Introduction to COSMOS
Overview
Teaching: 10 min
Exercises: 5 minQuestions
What is COSMOS useful for?
Objectives
Understanding how we can benefit from COSMOS for our research.
Describe COSMOS’s uses.
Locate helpful resources to learn more about COSMOS.
Motivation
- Social media platforms have become very popular to express individuals’ opinions, experiences and to promote ideas on a daily basis.
- Twitter is a powerful data source, even with a 280 character limit, for social scientists who are trying to understand and explain the ways in which society works.
- Accessing and analysing such a powerful and extensive data source is very complicated and requires high level computational skills.
- With COSMOS, you can collect, save, analyse and visualize real-time Twitter data easily.
Features
- COSMOS currently supports gender and language detection, sentiment analysis, qualitative overview, geospatial location analysis, keyword analysis, frequency analysis and social network analysis.
- To learn more about COSMOS and its features checkout Introducing COSMOS 2.0.
Before We Start
- Request an install link from http://socialdatalab.net/COSMOS.
- Follow the Setup instructions to install COSMOS Desktop on your machine.
- To start a collection, an internet connection is needed.
- After installing and running COSMOS, it opens automatically for you.
Getting help for COSMOS
You can find out a lot more about COSMOS at http://socialdatalab.net/COSMOS and check out introduction videos at http://socialdatalab.net/instruction-videos. You can fill the form and request an install link from the website. When you request COSMOS, you will receive an email from cosmosprojectuk@gmail.com which will including the download link and links to forms to report bugs and request new features. If you ever need help using COSMOS, you can contact us via this email address. Also, if you want to stay updated about COSMOS development, you can checkout the Blogposts section from the menu.
Key Points
COSMOS is compact, powerful and free software to collect and analyse social media data.
It aims to democratise access to social media data for social scientists and others.
Before using COSMOS
Overview
Teaching: 10 min
Exercises: 5 minQuestions
How do we authorise the collection of data from Twitter?
How to get the latest version of COSMOS?
Objectives
Authorising your Twitter account to use this collection service.
Updating COSMOS to the latest version before using it.
Lessons
1) Authorising your Twitter Account
After installing and setting up the COSMOS Desktop, here we will authorise your Twitter account before starting a collection:
- Click the plus button on the top left corner (in the show panel).
- Choose the ‘Start Twitter Collection’ option from the dropdown list.
-
Click the ‘Sign in with Twitter’ button on the pop-up window.
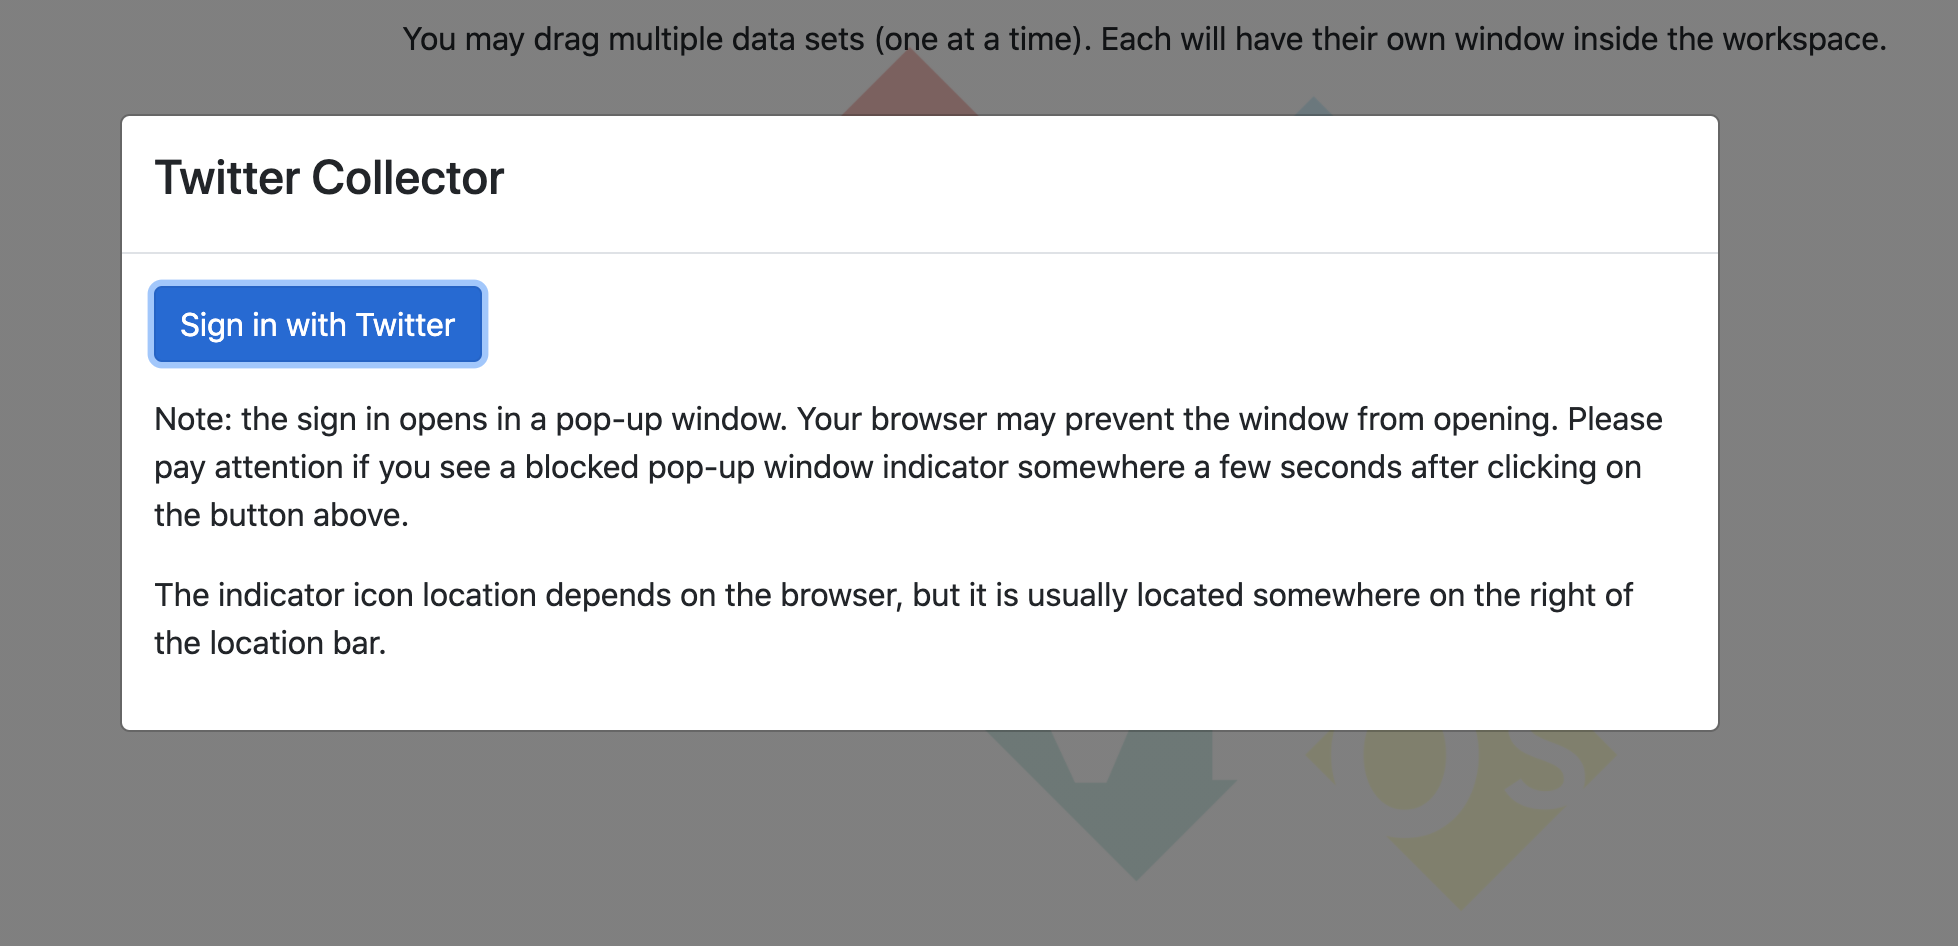
-
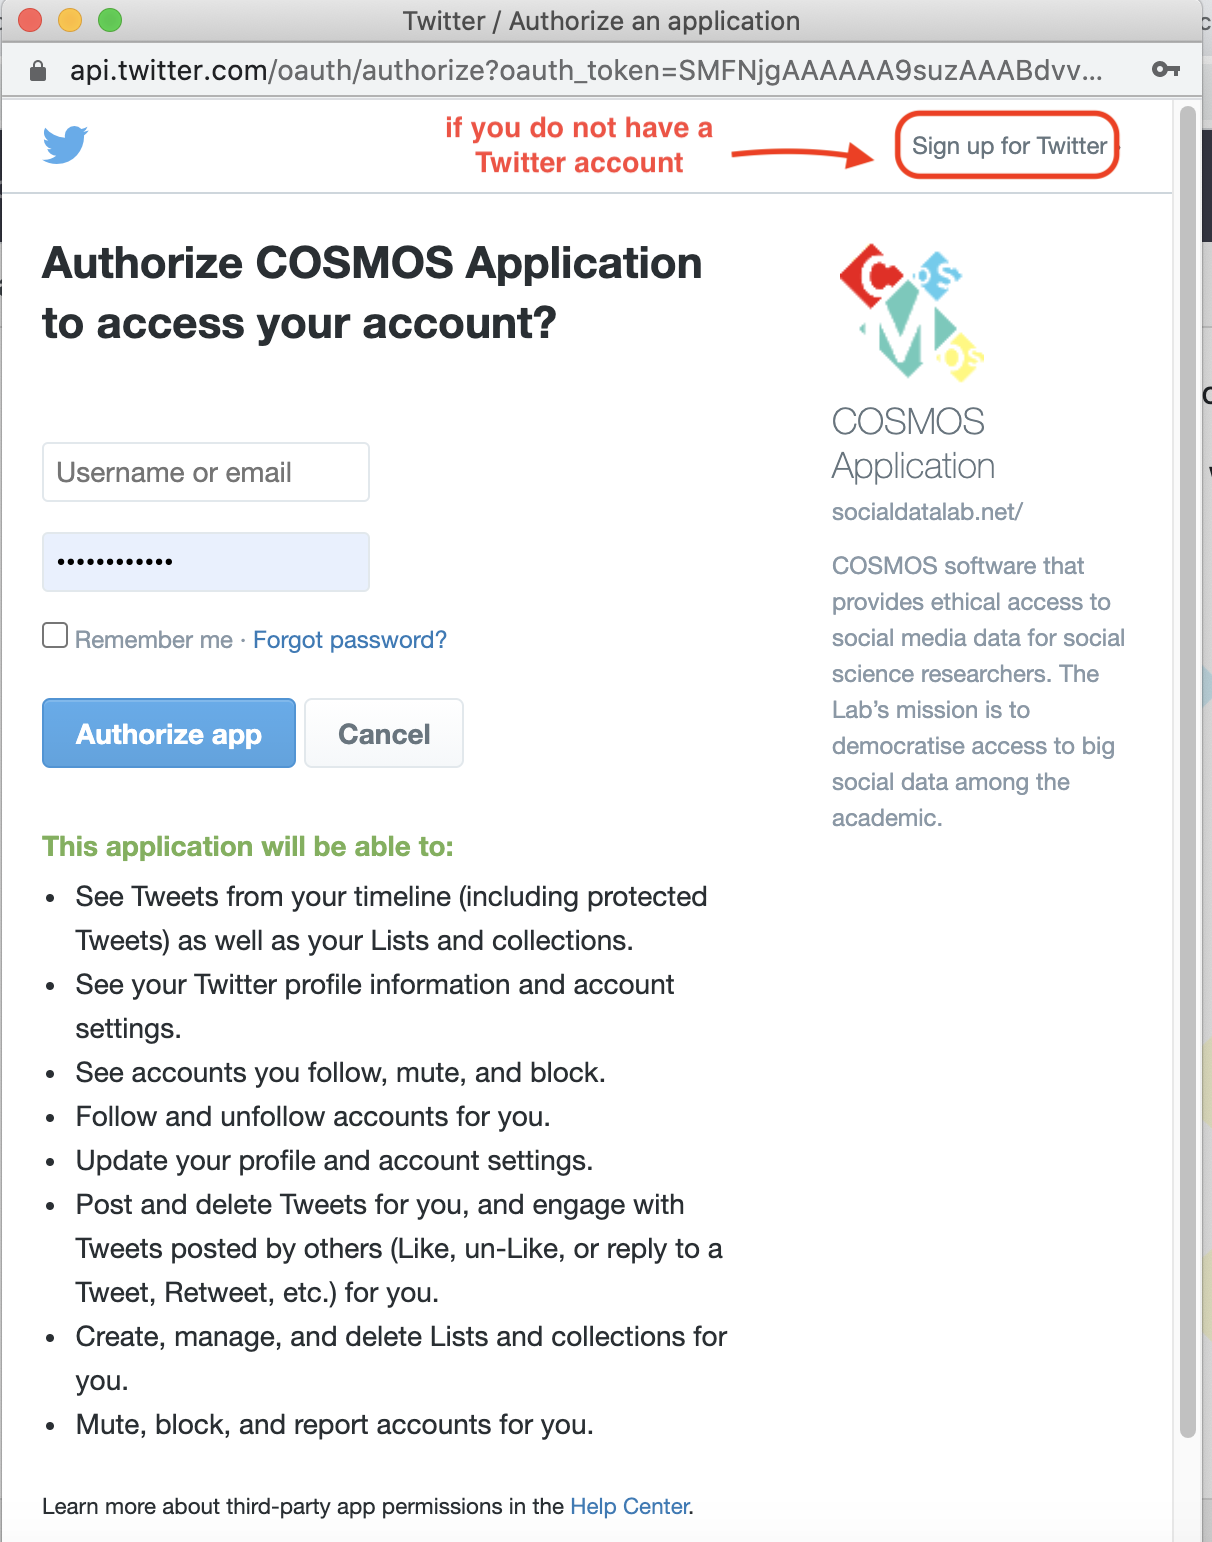
Fill-in the form with your Twitter username and password and click the ‘Authorize app’ button. If you do not have a Twitter account, you can sign up for Twitter by clicking the ‘Sign up for Twitter’ link on the top right corner of the page.
-
After seeing the ‘login was successful’ message, you will see the Twitter Collector pop-up window that means COSMOS is ready to start a collection.
2) Check for Updates
Once you install COSMOS on your computer, you do not need to reinstall COSMOS to receive new updates. Since COSMOS is in active development, we have developed a feature to enable you to get the latest version of COSMOS. COSMOS automarically checks for updates each time it’s started. You can also click on the menu button on the top right corner of the page and click on the ‘Check for updates’ option.
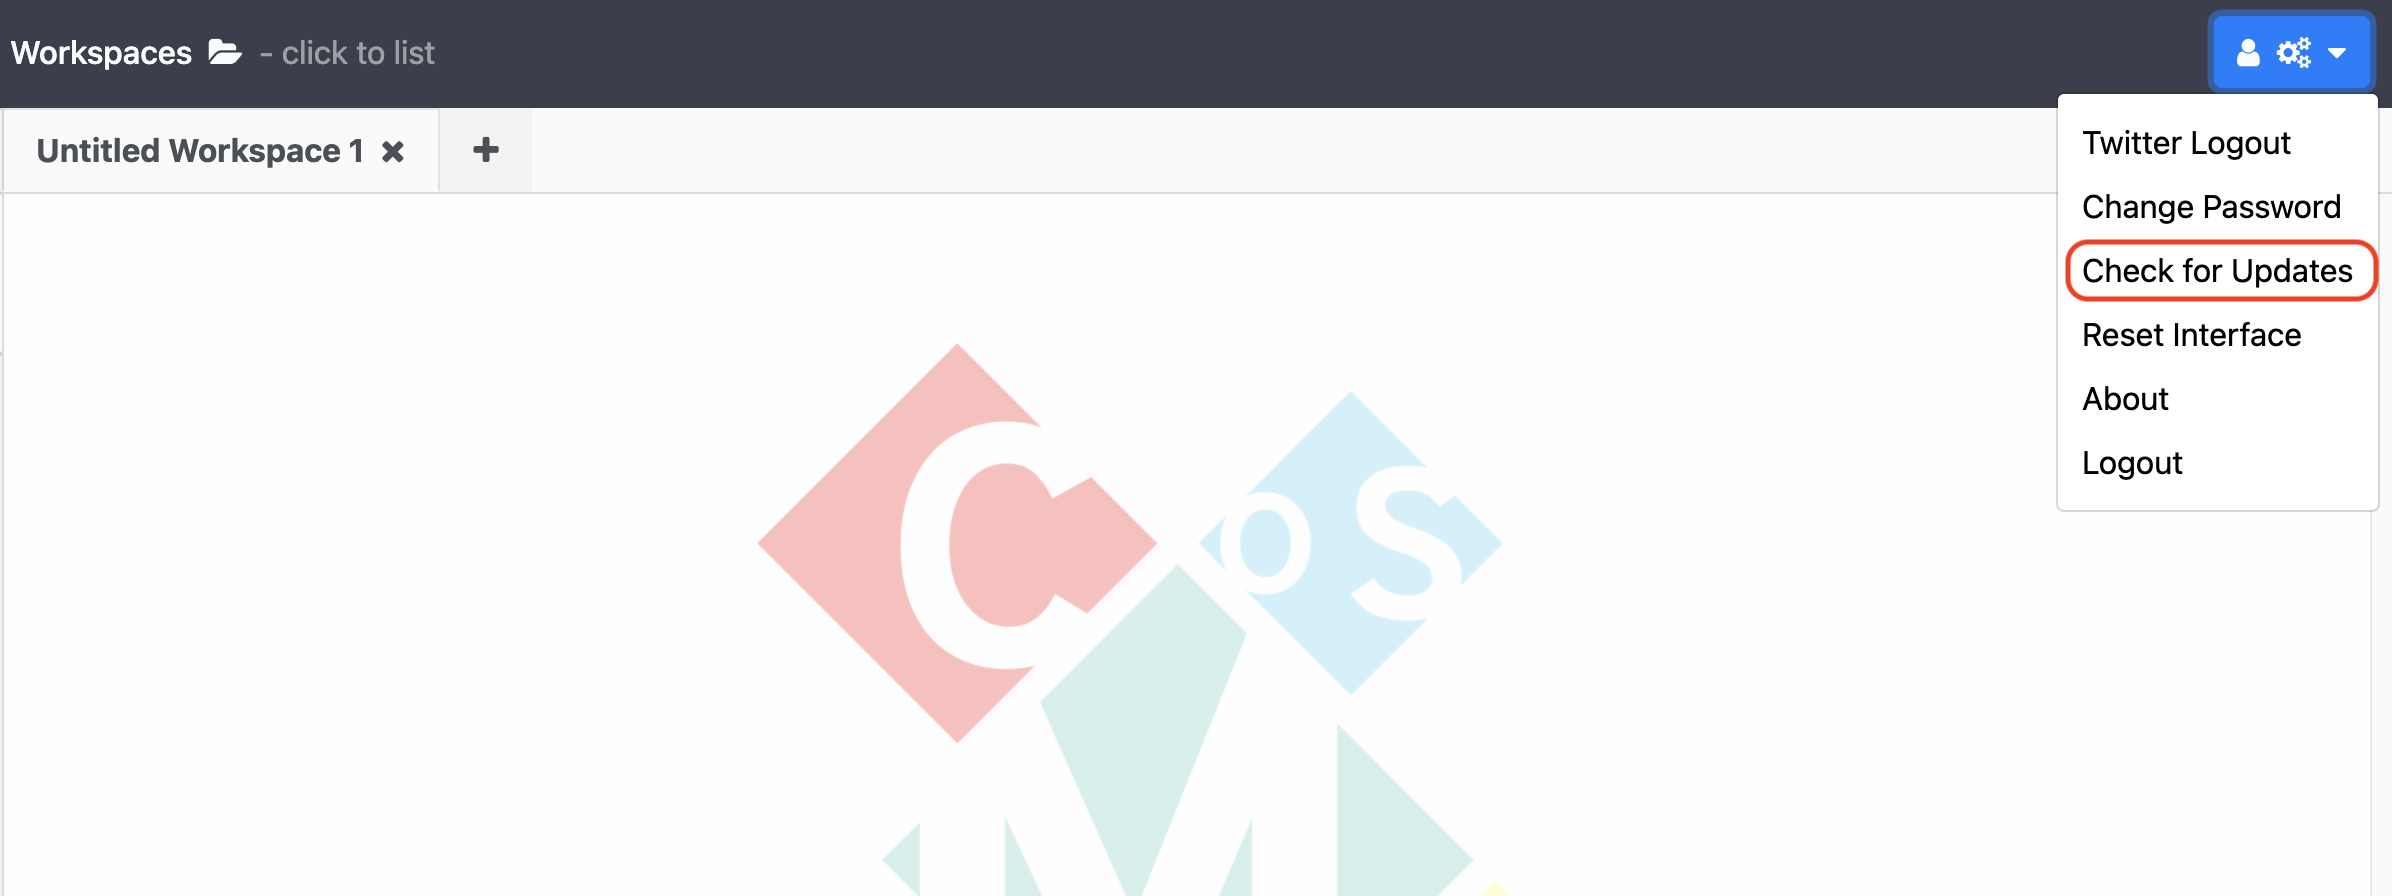
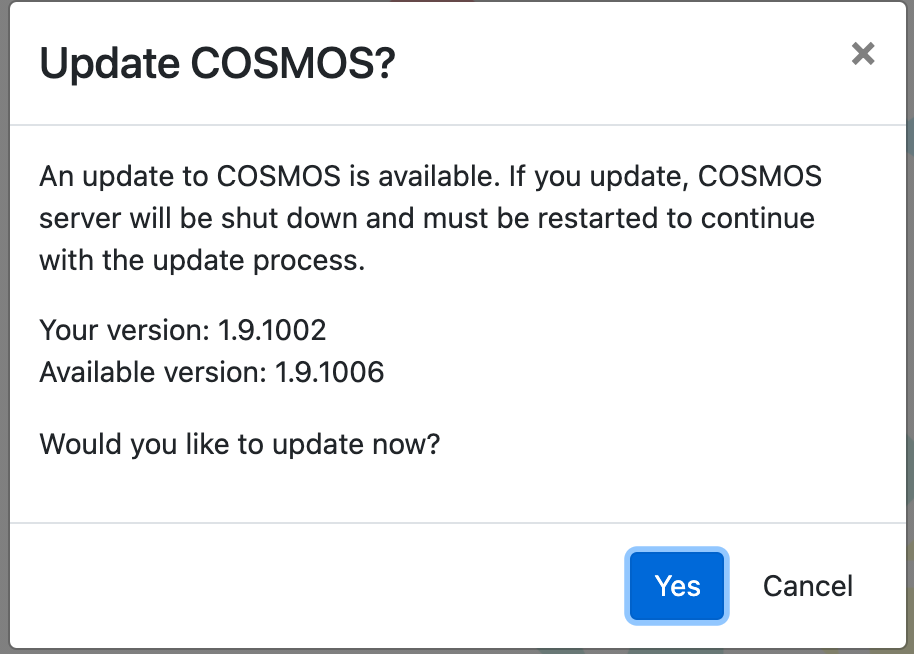
If there is a new version, click on the ‘yes’ option so you can upgrade to the latest version of the COSMOS. To use the latest version, you need to restart the COSMOS application.
You can also watch a YouTube video showing all COSMOS authorising processes by clicking the image below.
Exercises
1) Perform the steps to authorise your Twitter account for tweet collection.
2) Check for updates before using COSMOS. Did COSMOS automatically restart?
Key Points
To start a data collection, you must authorise your Twitter account.
To use the latest version of COSMOS, check for updates each time you run it.
Data collection screen
Overview
Teaching: 20 min
Exercises: 10 minQuestions
How do we collect data from Twitter?
How can we specify criteria for a data collection?
Objectives
Understanding the data collection process.
Before We Start
- Setup COSMOS.
- Authorise your Twitter account to collect data.
- Check if there is an update.
Lessons
1) Collection Process
The Twitter API allows COSMOS to stream public Tweets from the platform in real-time. COSMOS uses filtered stream endpoints to narrow criteria you defined from the COSMOS interface such as keywords, hashtags, account names, language, place(see the Data Collection Screen section). To get more information about filtering realtime tweets, follow the link below:
https://developer.twitter.com/en/docs/twitter-api/v1/tweets/filter-realtime/guides/basic-stream-parameters
Creating a filter is helpful because it prevents you from collecting unwanted tweets for your research.
After you start a collection through COSMOS, you will begin receiving a stream of data. All streamig data is saved in JSON format in the /home/COSMOS-files/tmp folder temporarily. For each collection, COSMOS creates a folder which has the same name with the collection in the tmp folder. Folder structure:
<%collection_year%>/<%collection_month%>/<%collection_day%>/twitter-collection-<%hour%>.json
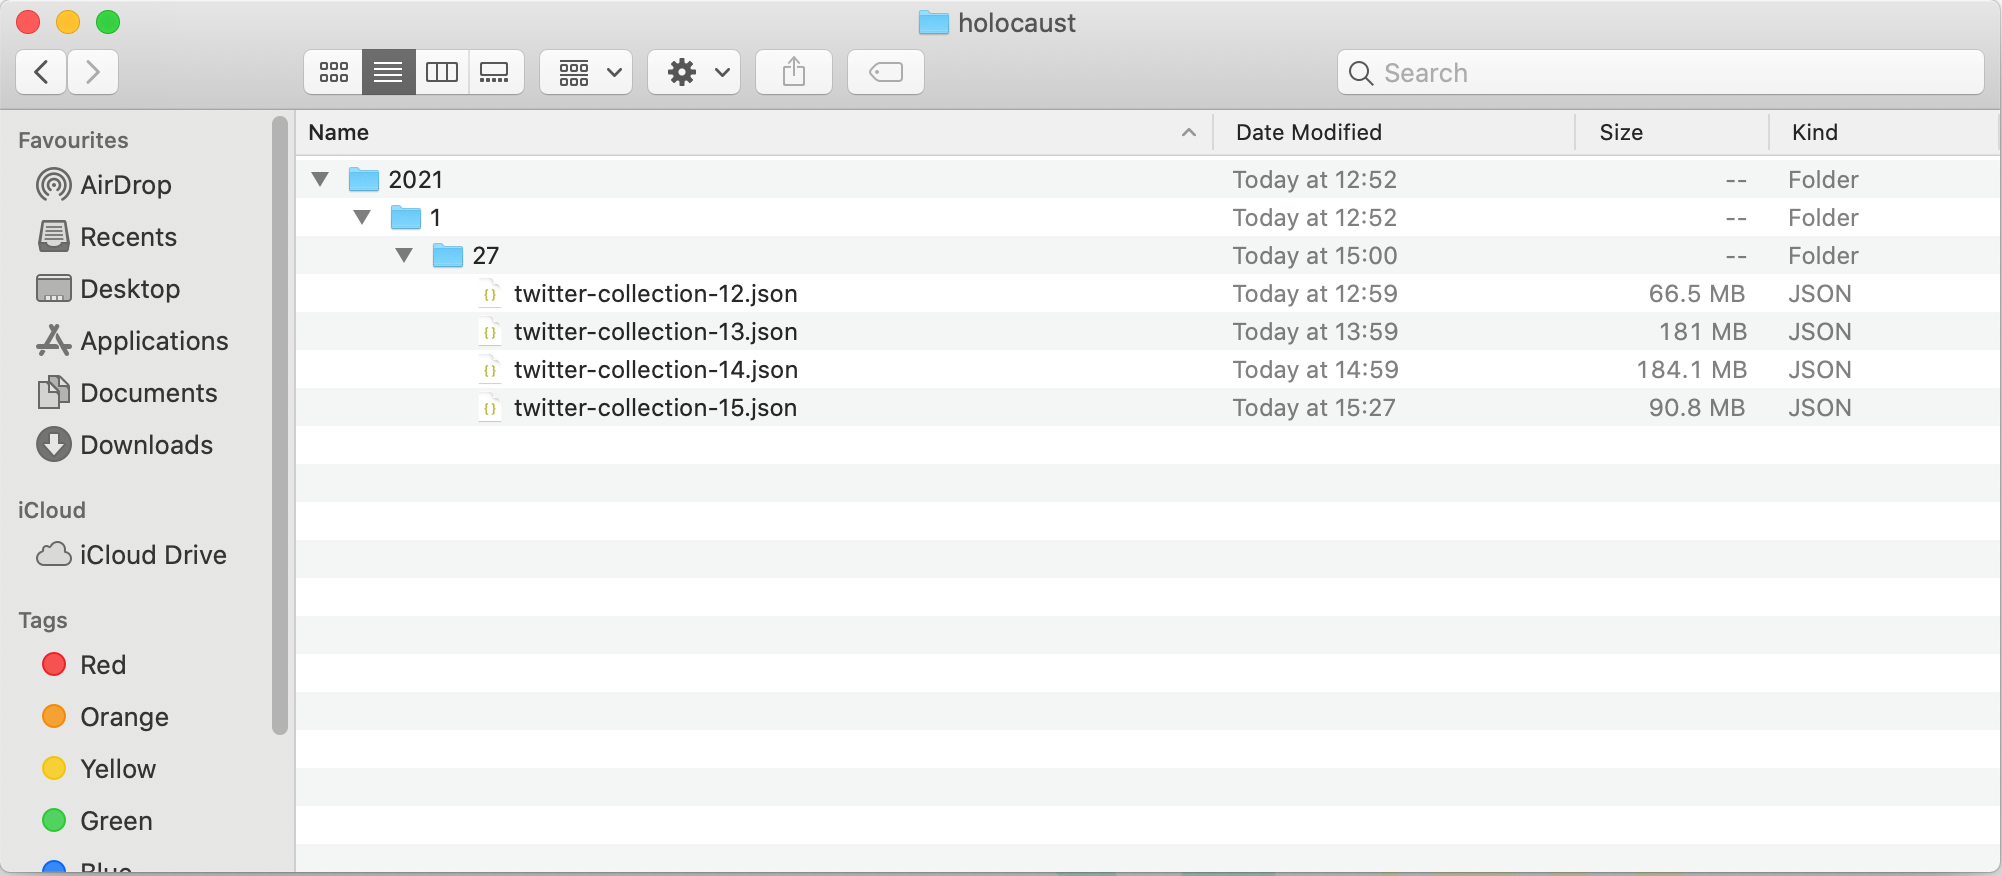
Since COSMOS does not show all entities from the raw streamed data in it’s interface, the temp files could be beneficial if these need to be accessed. Later, COSMOS creates a local database on your machine and moves the dataset to the database from the ‘tmp’ folder.
2) Data Collection Screen
After setting up COSMOS on your machine, you can start the software as instructed.
Once COSMOS is launched in your browser, click the plus button on the top left corner. You will see the options Import Data, Import RSS Feed and Start Twitter Collection. You can generate a Twitter collection by filtering or sampling:
Filter: COSMOS provides a filtering feature to narrow a collection while streaming data from Twitter.
- Click
Start Twitter Collection. - Choose the collecting type as
Filter. -
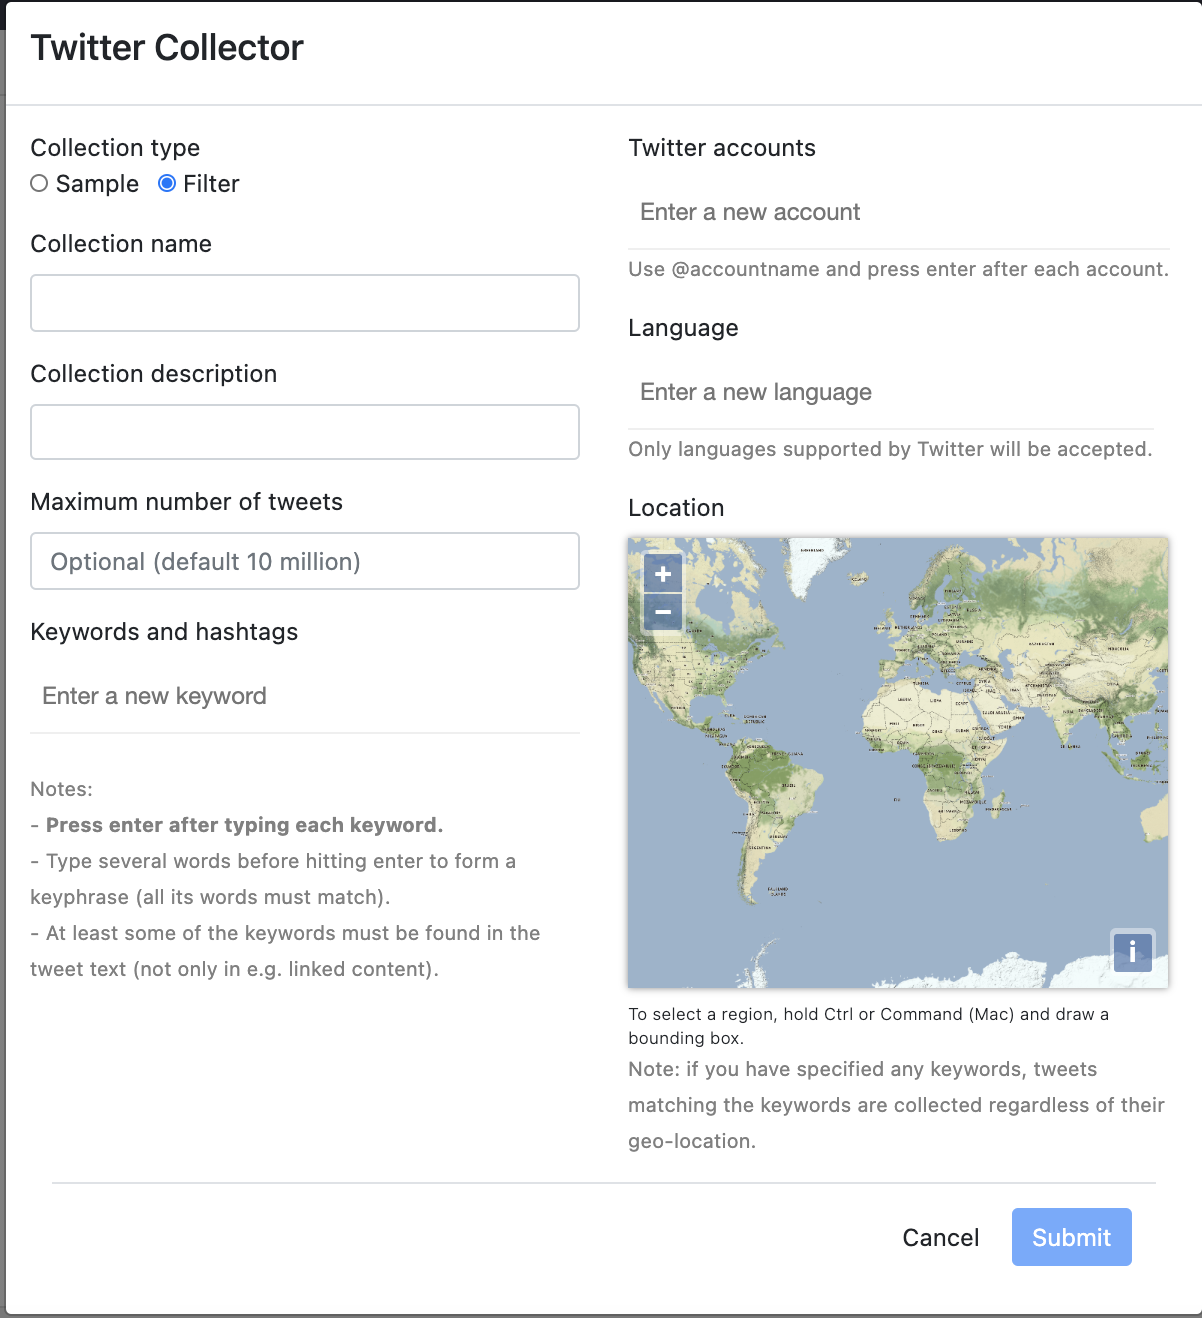
Give an appropriate name for the collection on the
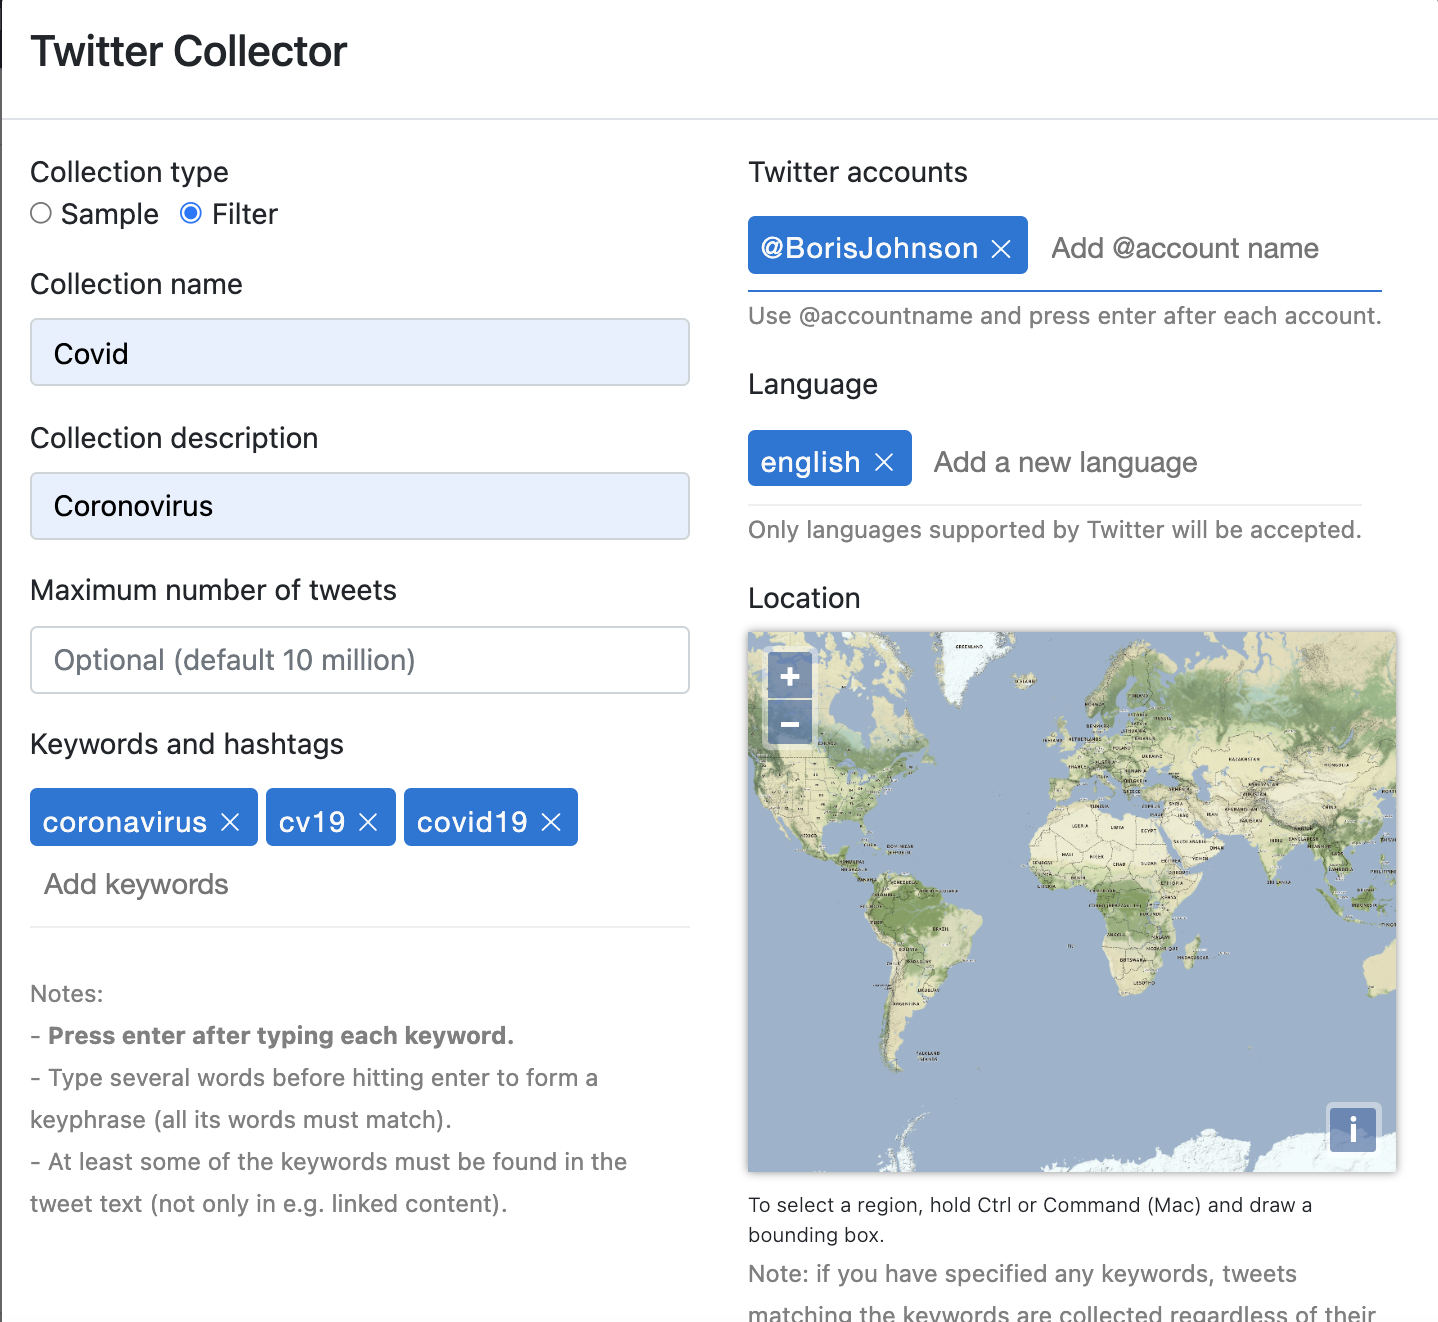
Twitter Collectorpop-up window. - Start the collection based on filtering criteria:
Keywords and hashtags,Language,Location,Twitter accountsandMaximum number of tweetsby filling the form. - While filling the
Keywords and hashtags,Twitter accountsandLanguagesections, you should pressEnterafter typing each entry. Once you pressEnter, it should turn blue.
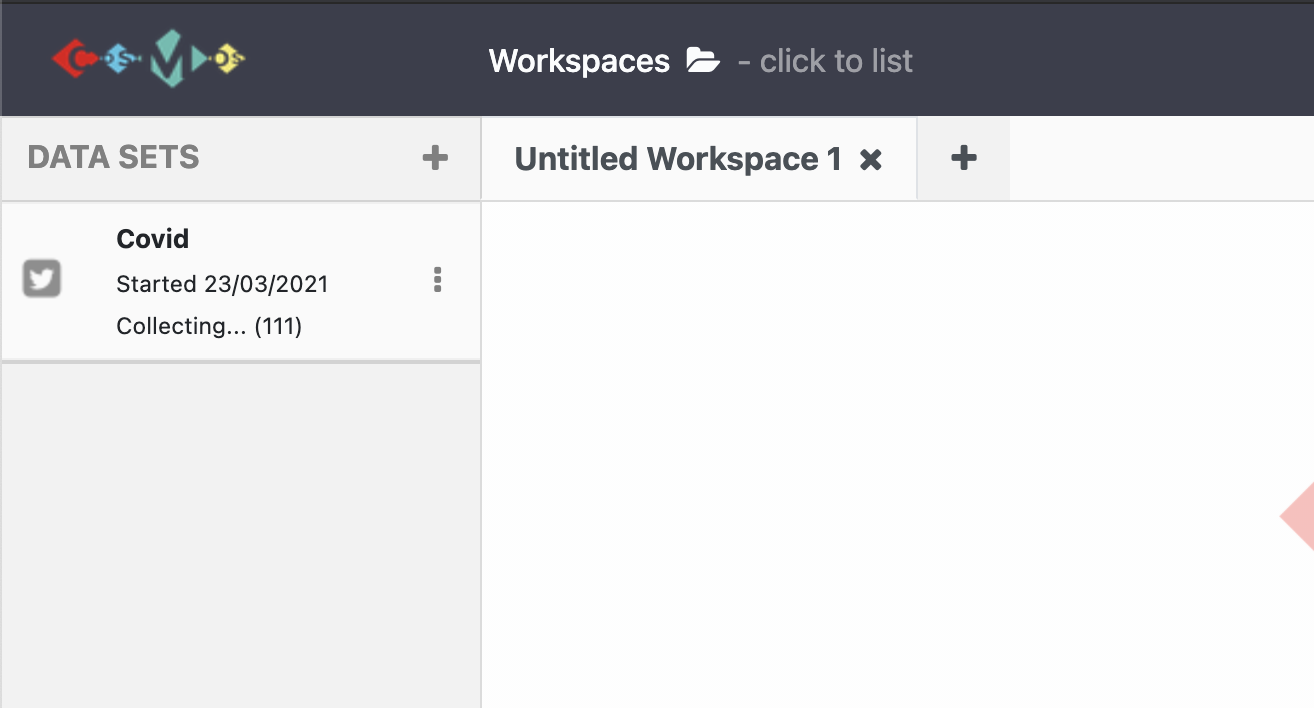
- When the form is filled, click the submit button. Once the collection starts, it appears on the show panel.
Tip:
- When you enter multiple keywords, hashtags or accounts when filtering the collection, the Twitter API determines which results to return using logical OR. For example; If you start a collection with keywords
covid,vaccineandcoronavirusand Twitter account@BorisJohnson, you would get;
- tweets posted by Boris Johnson (they do not have to be related to covid),
- tweets contains
covid,vaccineorcoronaviruskeywords.- Unlike keywords, hashtags and accounts, the
languagesearch term uses logical AND. If we add an English language filter for the example collection above, you will get only English tweets with the keywords or accounts.You can learn more about this at https://developer.twitter.com/en/docs/twitter-api/v1/tweets/filter-realtime/guides/basic-stream-parameters
Sample: COSMOS can stream tweets without any filter or specification.
- Click
Start Twitter Collection. - Choose the collecting type as
Sample. - Specify the
Collection name,Collection descriptionandMaximum number of tweetsclick theSubmitbutton.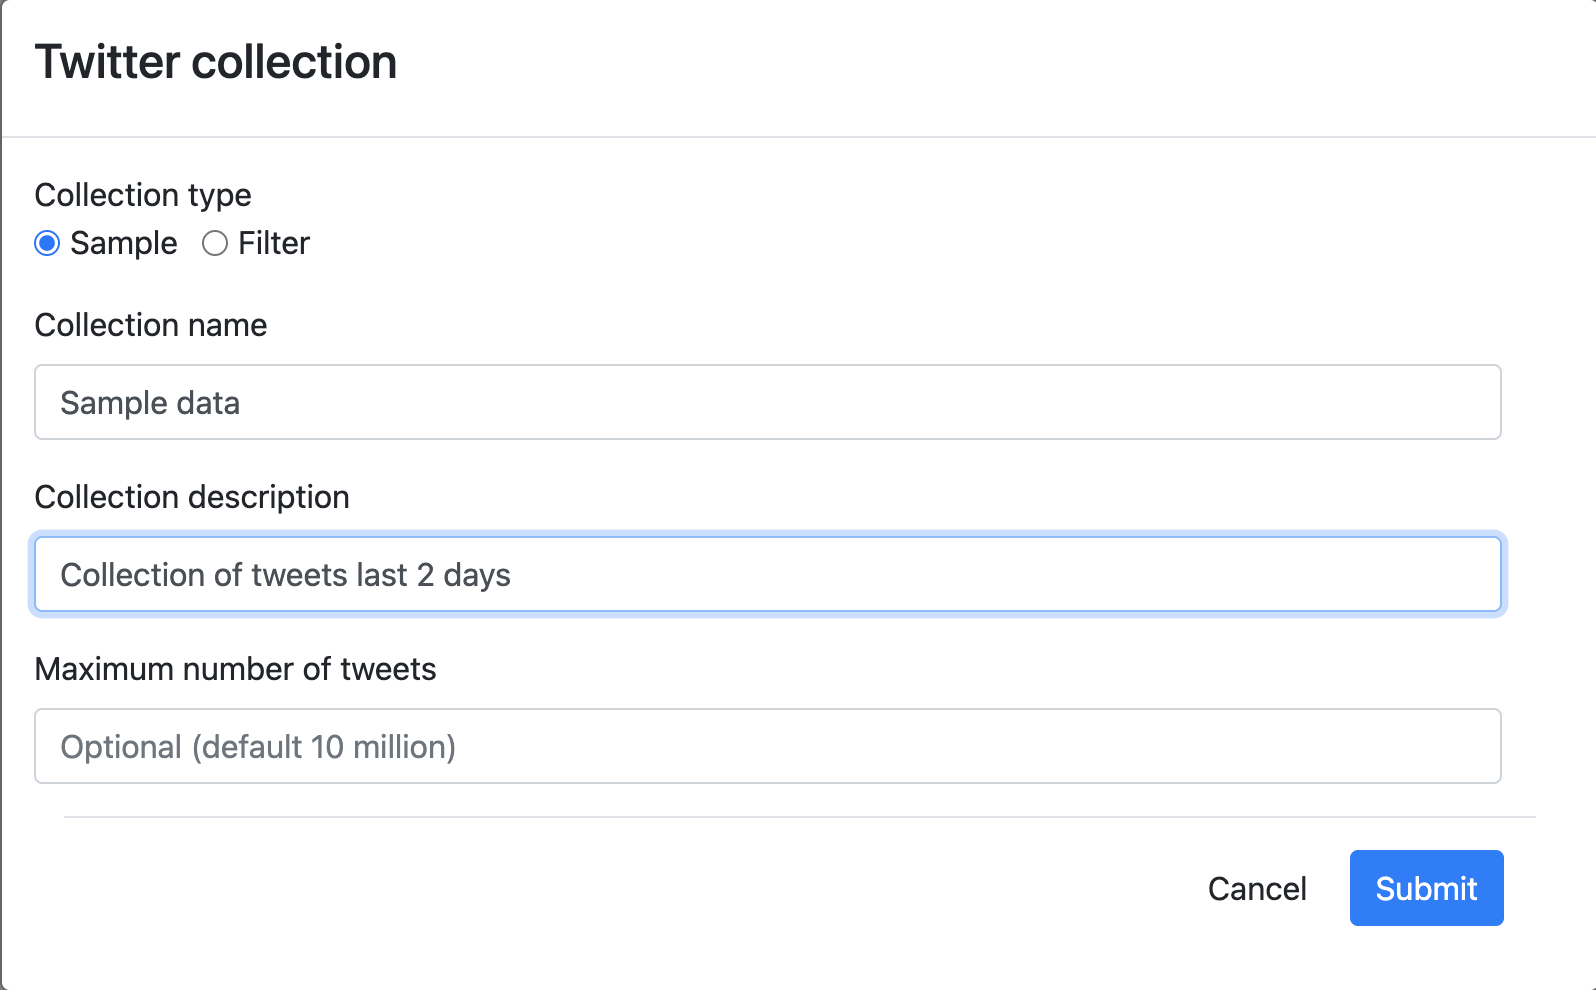
- Once you click, the sample dataset will appears on the showpanel.
3) More on Collections
The collection takes time as it streams tweets in real-time.
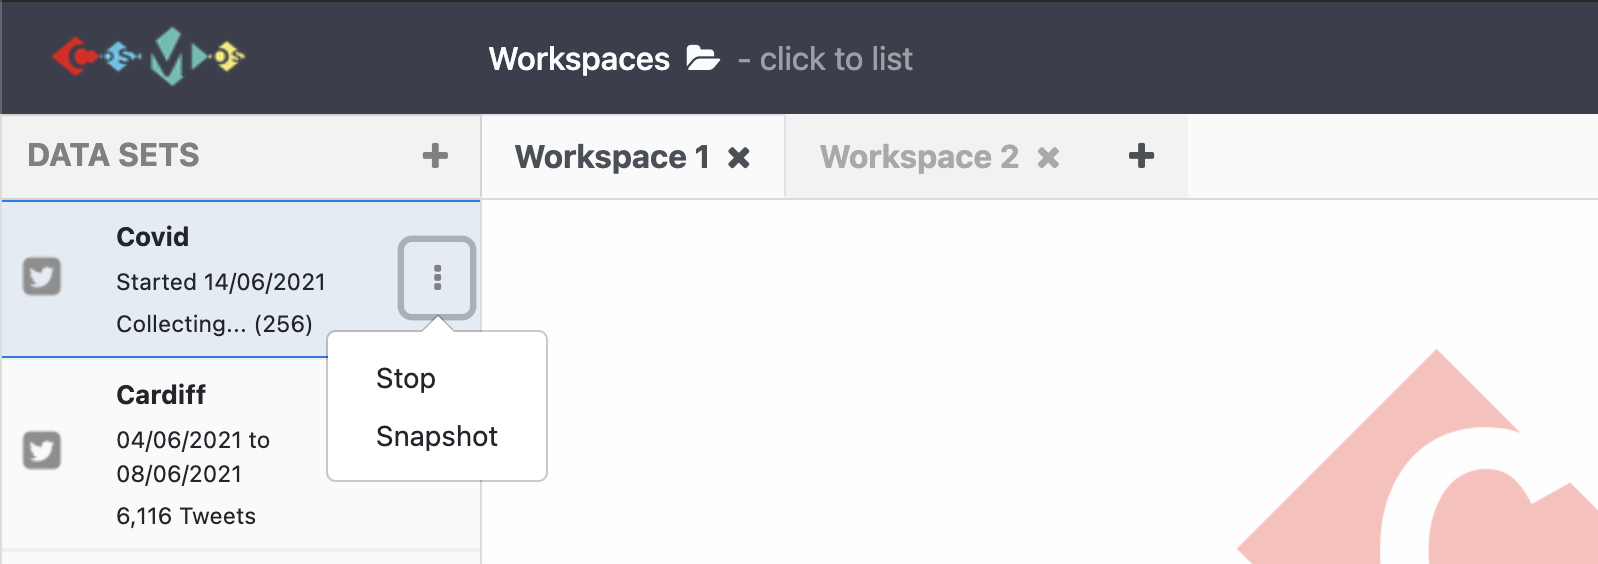
While the collection continues, clicking the three dots on the show panel:
- Stop the collection when enough data has been collected.
- Snapshot the collection to create a subset consisting of data which has been collected until the snapshot.
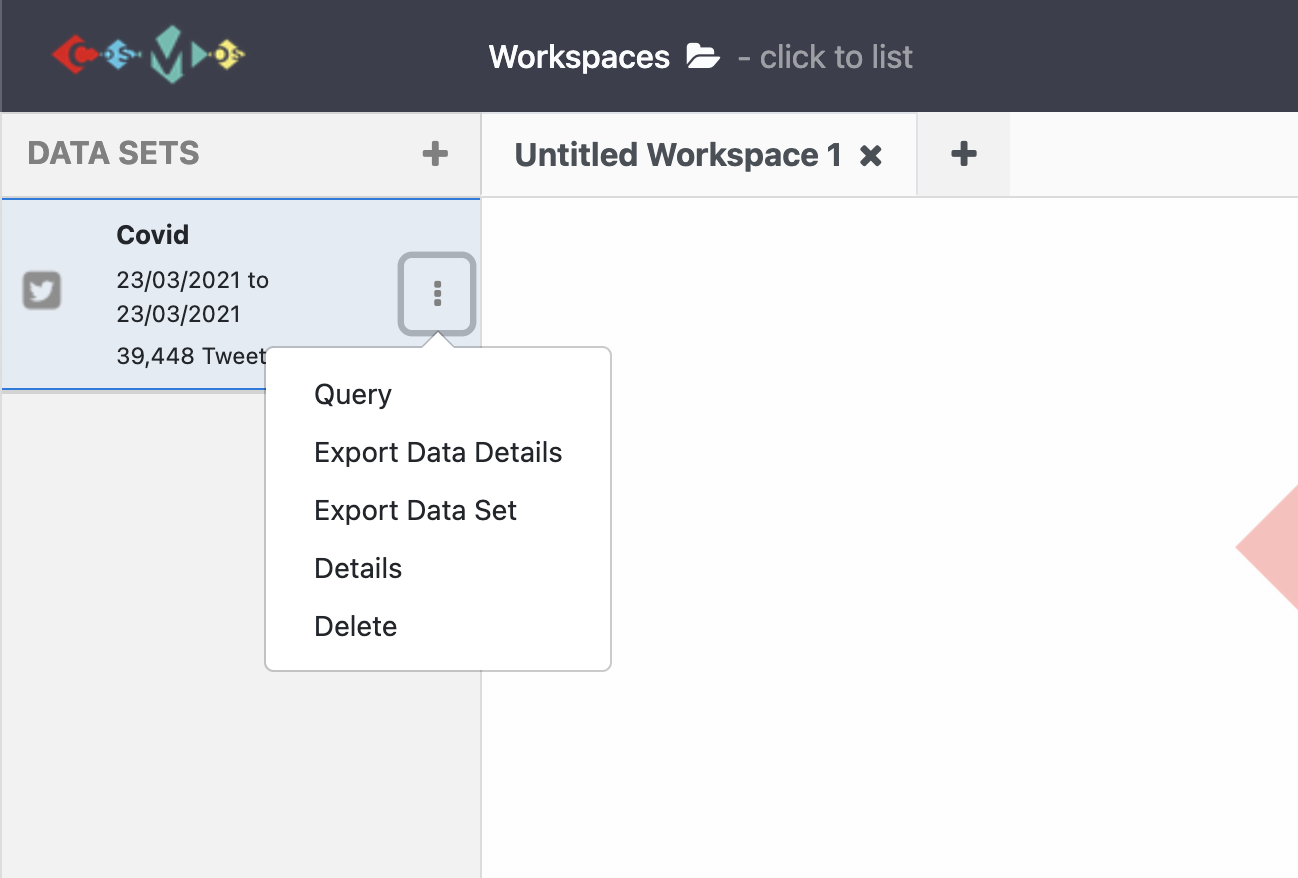
When the collection has been stopped, clicking the three dots on the show panel:
- Query: You can filter your collected data based on
tweets sentiment,date,gender,languageandcountry.When you query the dataset, it creates a subset of the data based on the query details. This feature helps to remove noisy data and shorten the data analysis process.
- Export Data Details
- Export collected data: Exports collected data as a CSV file.
- Delete
- Details of data set: Exports the dataset’s details as a json file e.g. date started, name of the collection, …
You can also watch a YouTube video showing all COSMOS data collection processes by clicking the image below.
Tip:
- A maximum of two data collections can be started simultaneously because of Twitter API rate limits. You can learn more about rate limits
Exercise
Collect
10000english tweets using,keywords, for,Twitter accounts using COSMOS 2.0
Exercise
While collection continues;
- Create a subset and give it an appropriate name. Which COSMOS feature did you use for this purpose?
- Create and name a subset filtering only sentimentally
negativetweets in thelast two days. Which COSMOS feature did you use for this purpose?Solution
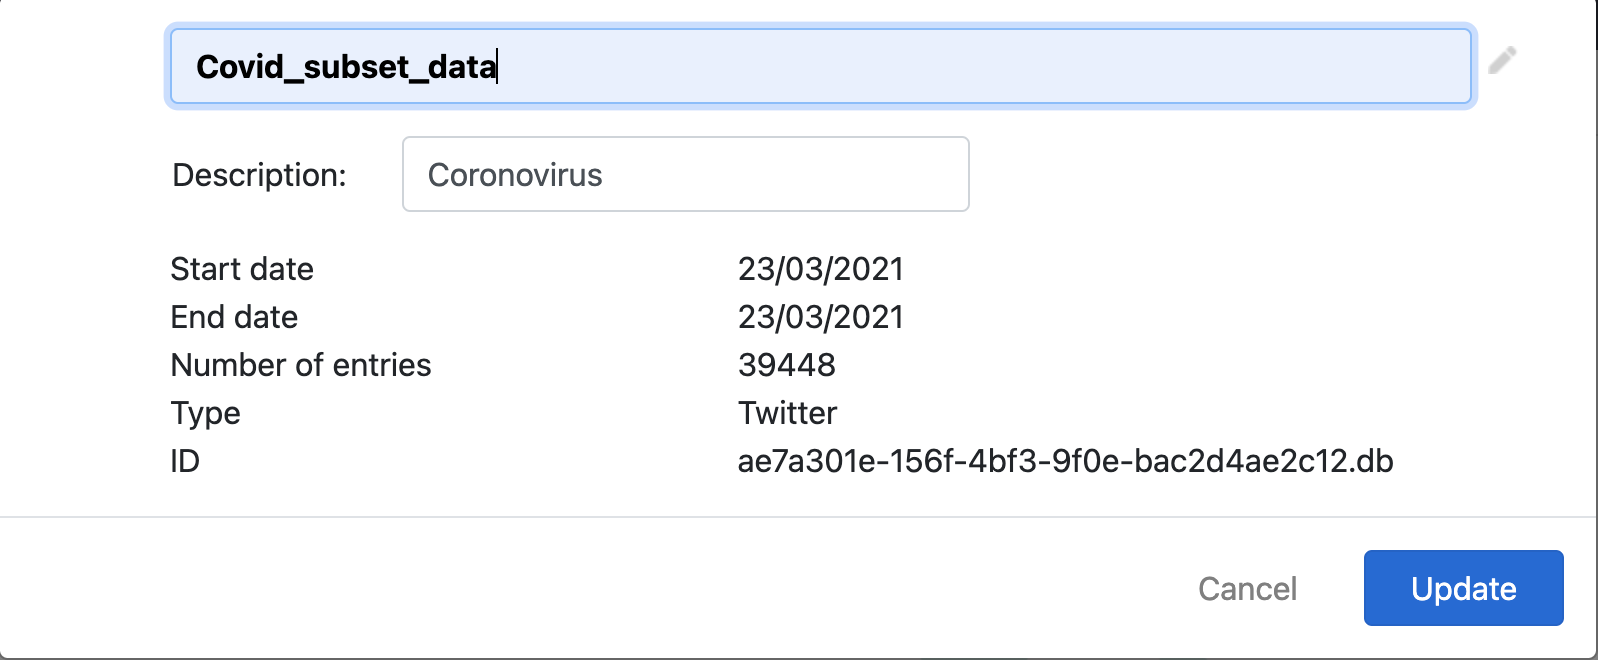
- Click 3 dots on the panel and select
Snapshot. After creating a subset click 3 dots and chooseDetailsoption from the dropdown menu, edit the name of the subset and hit theUpdatebutton.- Click 3 dots on the panel and select
Query. Then, fill the form on the pop-up window choosing sentiment score as a negative number(between -5 to 0) and entering a date of last two days and click theQuerybutton. After creating a subset, click 3 dots again and choose theDetailsoption from the dropdown menu, edit the name of the subset and hit theUpdatebutton.
Key Points
COSMOS can collect twitter data from Twitter.
COSMOS can filter collections based on a variety of criteria.
COSMOS can create subsets of the data while the collection continues.
Importing pre-existing data
Overview
Teaching: 5 min
Exercises: 5 minQuestions
How can we use pre-existing data on COSMOS?
Objectives
Able to use pre-existing Twitter data on COSMOS.
Lesson
After setting up COSMOS on your computer, you can start the software as instructed.
Once COSMOS is launched in your browser, click the plus button on the top left corner. Once you click the plus, you will see a dropdown menu which contains: Import Data, Import RSS Feed and Start Twitter Collection subitems. To import pre-existing data on COSMOS:
- Click
Import Data. - Choose between the options
drag and droporbrowseto import a single file into COSMOS. - Name the dataset and write a description by filling the form on the popup window.
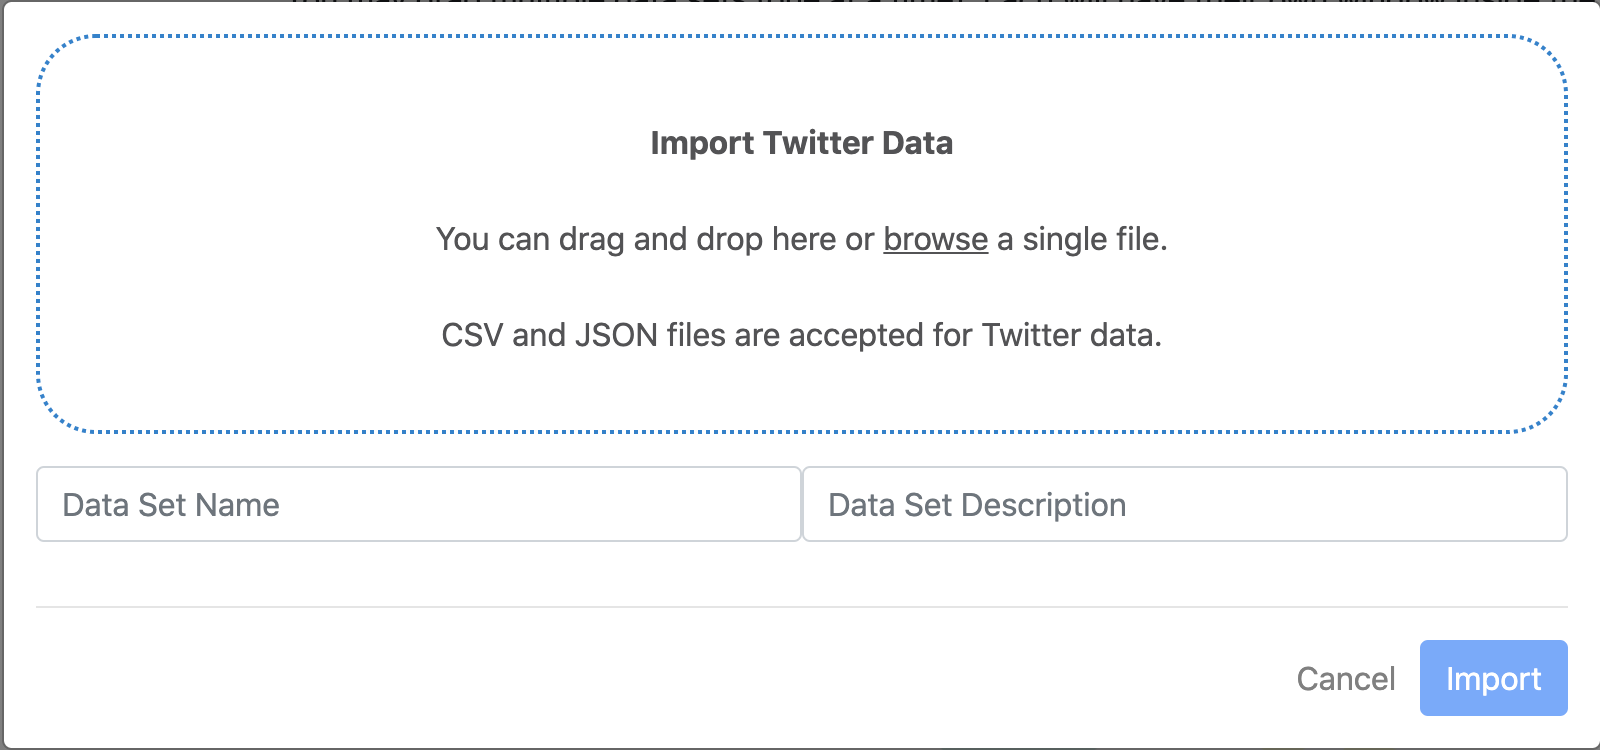
- After filling the form and selecting the file, just hit the
importbutton. - The imported data set appears on the
Show Paneland it is ready to use.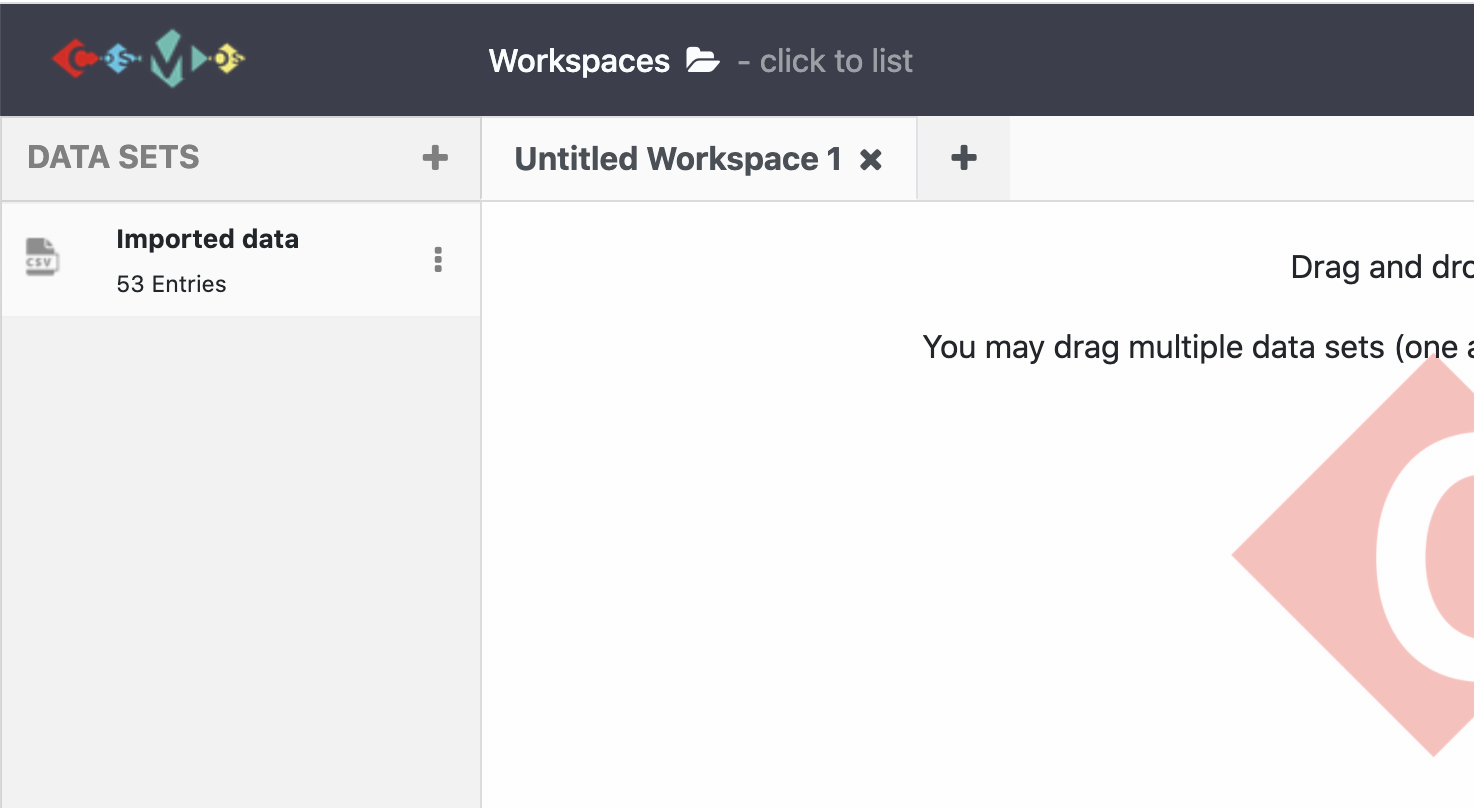
Tip:
- Only CSV and JSON files are accepted for Twitter data.
- To be able to visualize and analyse Twitter dataset in COSMOS, dataset has to have these entitites in this specific order: ‘Language_code’, ‘Timestamp’, ‘Longitude’, ‘Tweeet_text’, ‘Tweet_id’, ‘Screen_name’, ‘Latitude’.
You can also watch a YouTube video showing all COSMOS importing pre-existing data processes by clicking the image below.
Exercise
- Import and name any pre-existing data on COSMOS following the same steps.
Key Points
COSMOS can be used for pre-existing data.
COSMOS can only use CSV and JSON data formats.
Visualizations
Overview
Teaching: 30 min
Exercises: 20 minQuestions
How do we visualize data on COSMOS?
What kind of data analysis COSMOS provides?
Objectives
Understanding visualization process on COSMOS.
Understanding types of data analysis options with COSMOS.
Lessons
1. Visualize the Data Collection
Once enough data has been collected or imported using COSMOS, it is time to visualize data to obtain the details and information we are looking for. To start visualization:
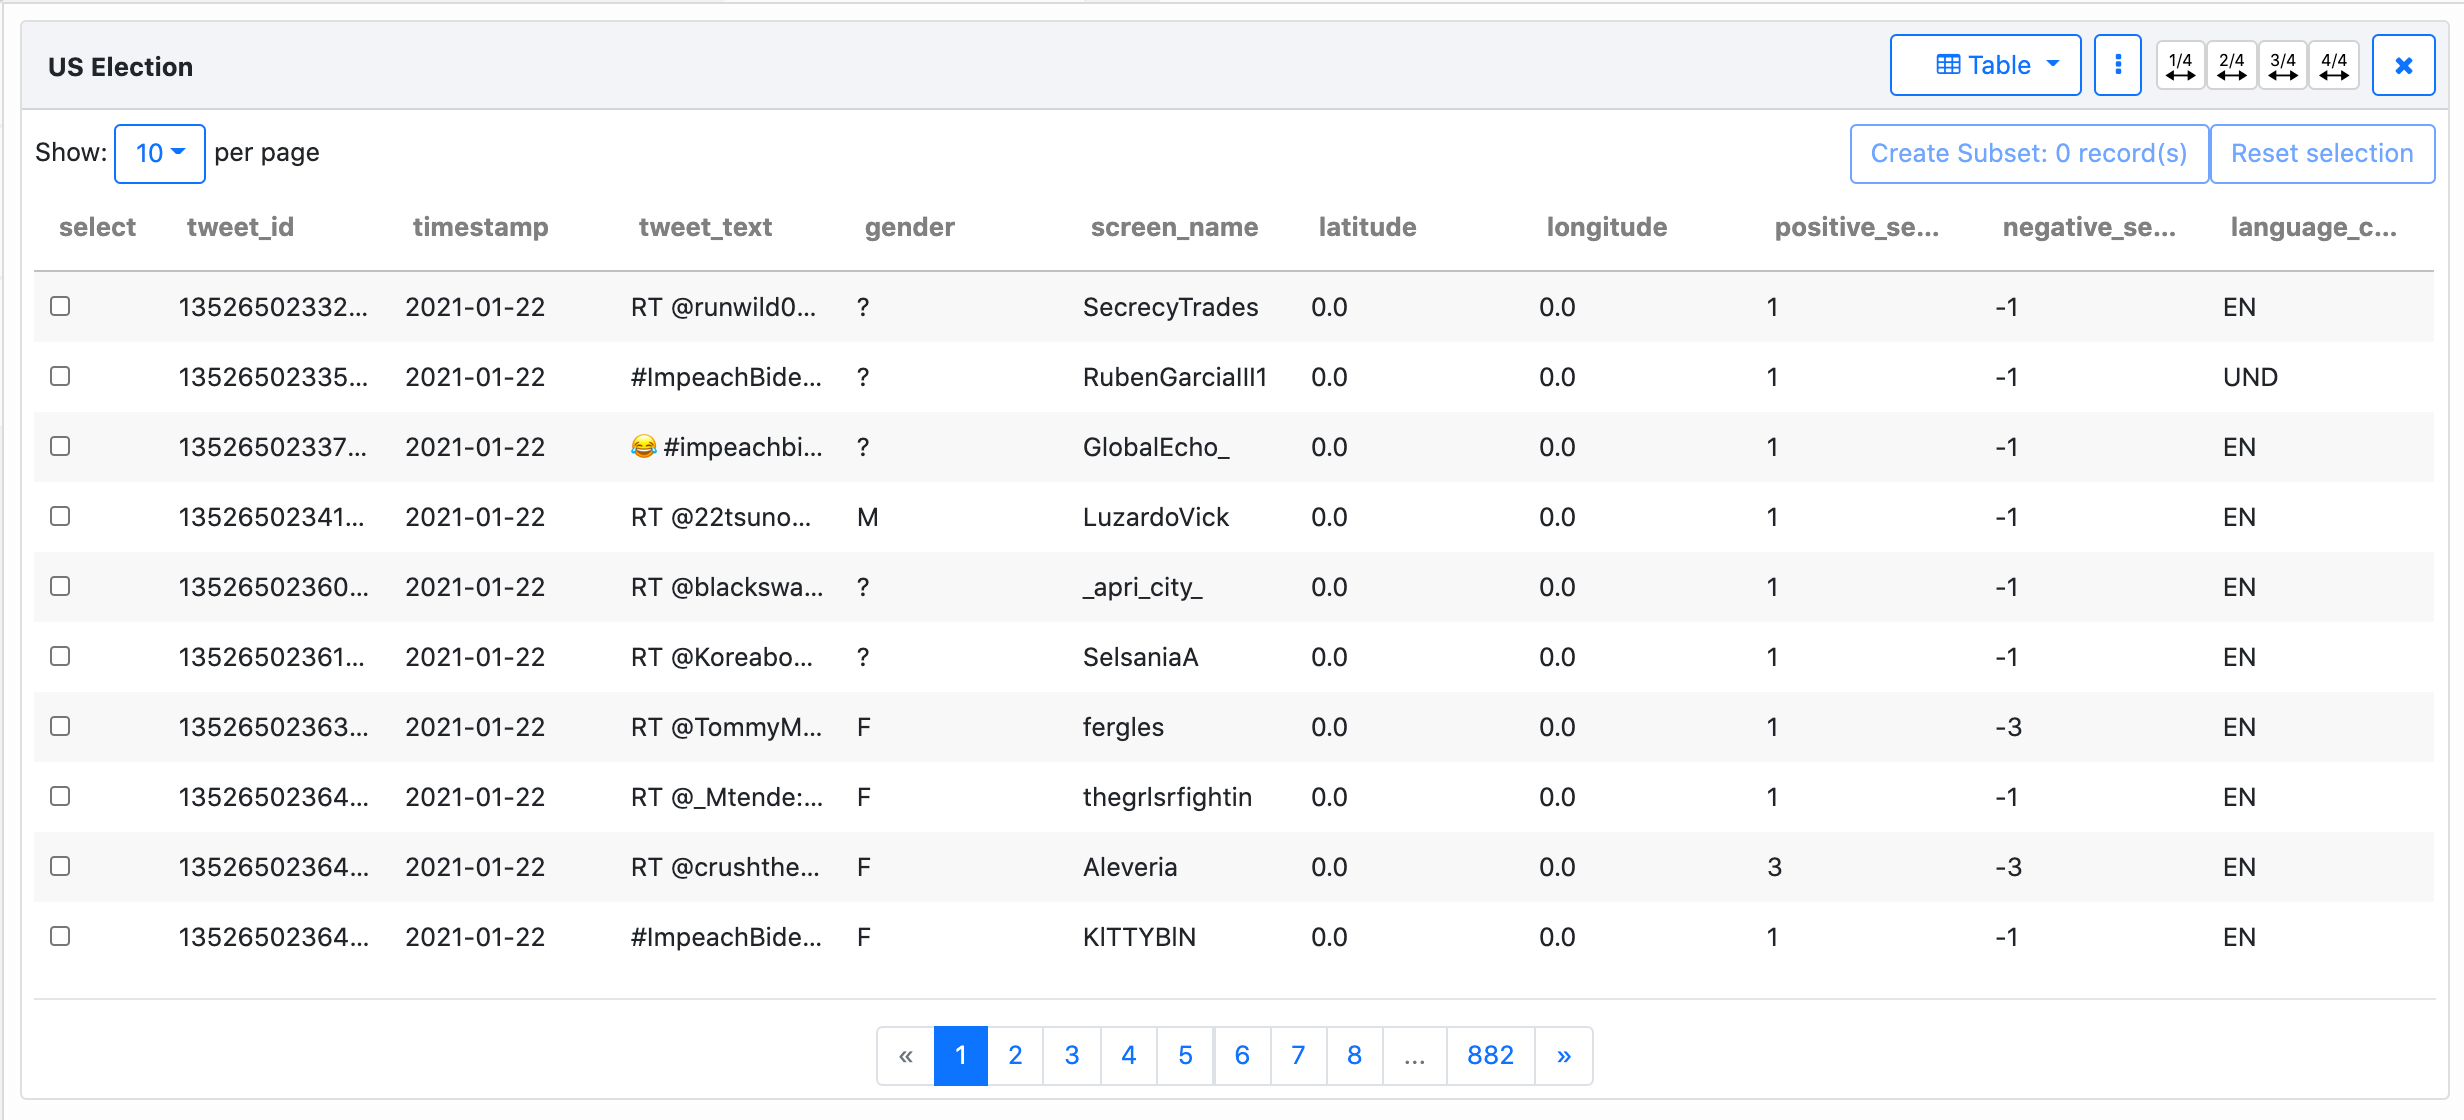
Drag and dropthe data collection to theworkspace- Once you drag and drop the data collection to the workspace,
table viewopens automatically. This view provides a quick overview of dataset details for both Twitter entities and the ones identified by COSMOS such as ‘gender’.
2. Multiple Visualization Views
There are 10 visualization options in COSMOS. When you click the little arrow on the Table button (top of the right-hand side of the page), it shows all options (List, Table, Text, Word Cloud, Frequency, Network, Map, Pie Chart, Line Chart)
If you want to visualize the same data collection using more than one option:
- Click the 3 dots button on the right-hand side of the page and choose
Duplicate. - When it is duplicated, you can choose one of the visualization options. To do that, click the
Tablebutton and choose one from the drop-down menu.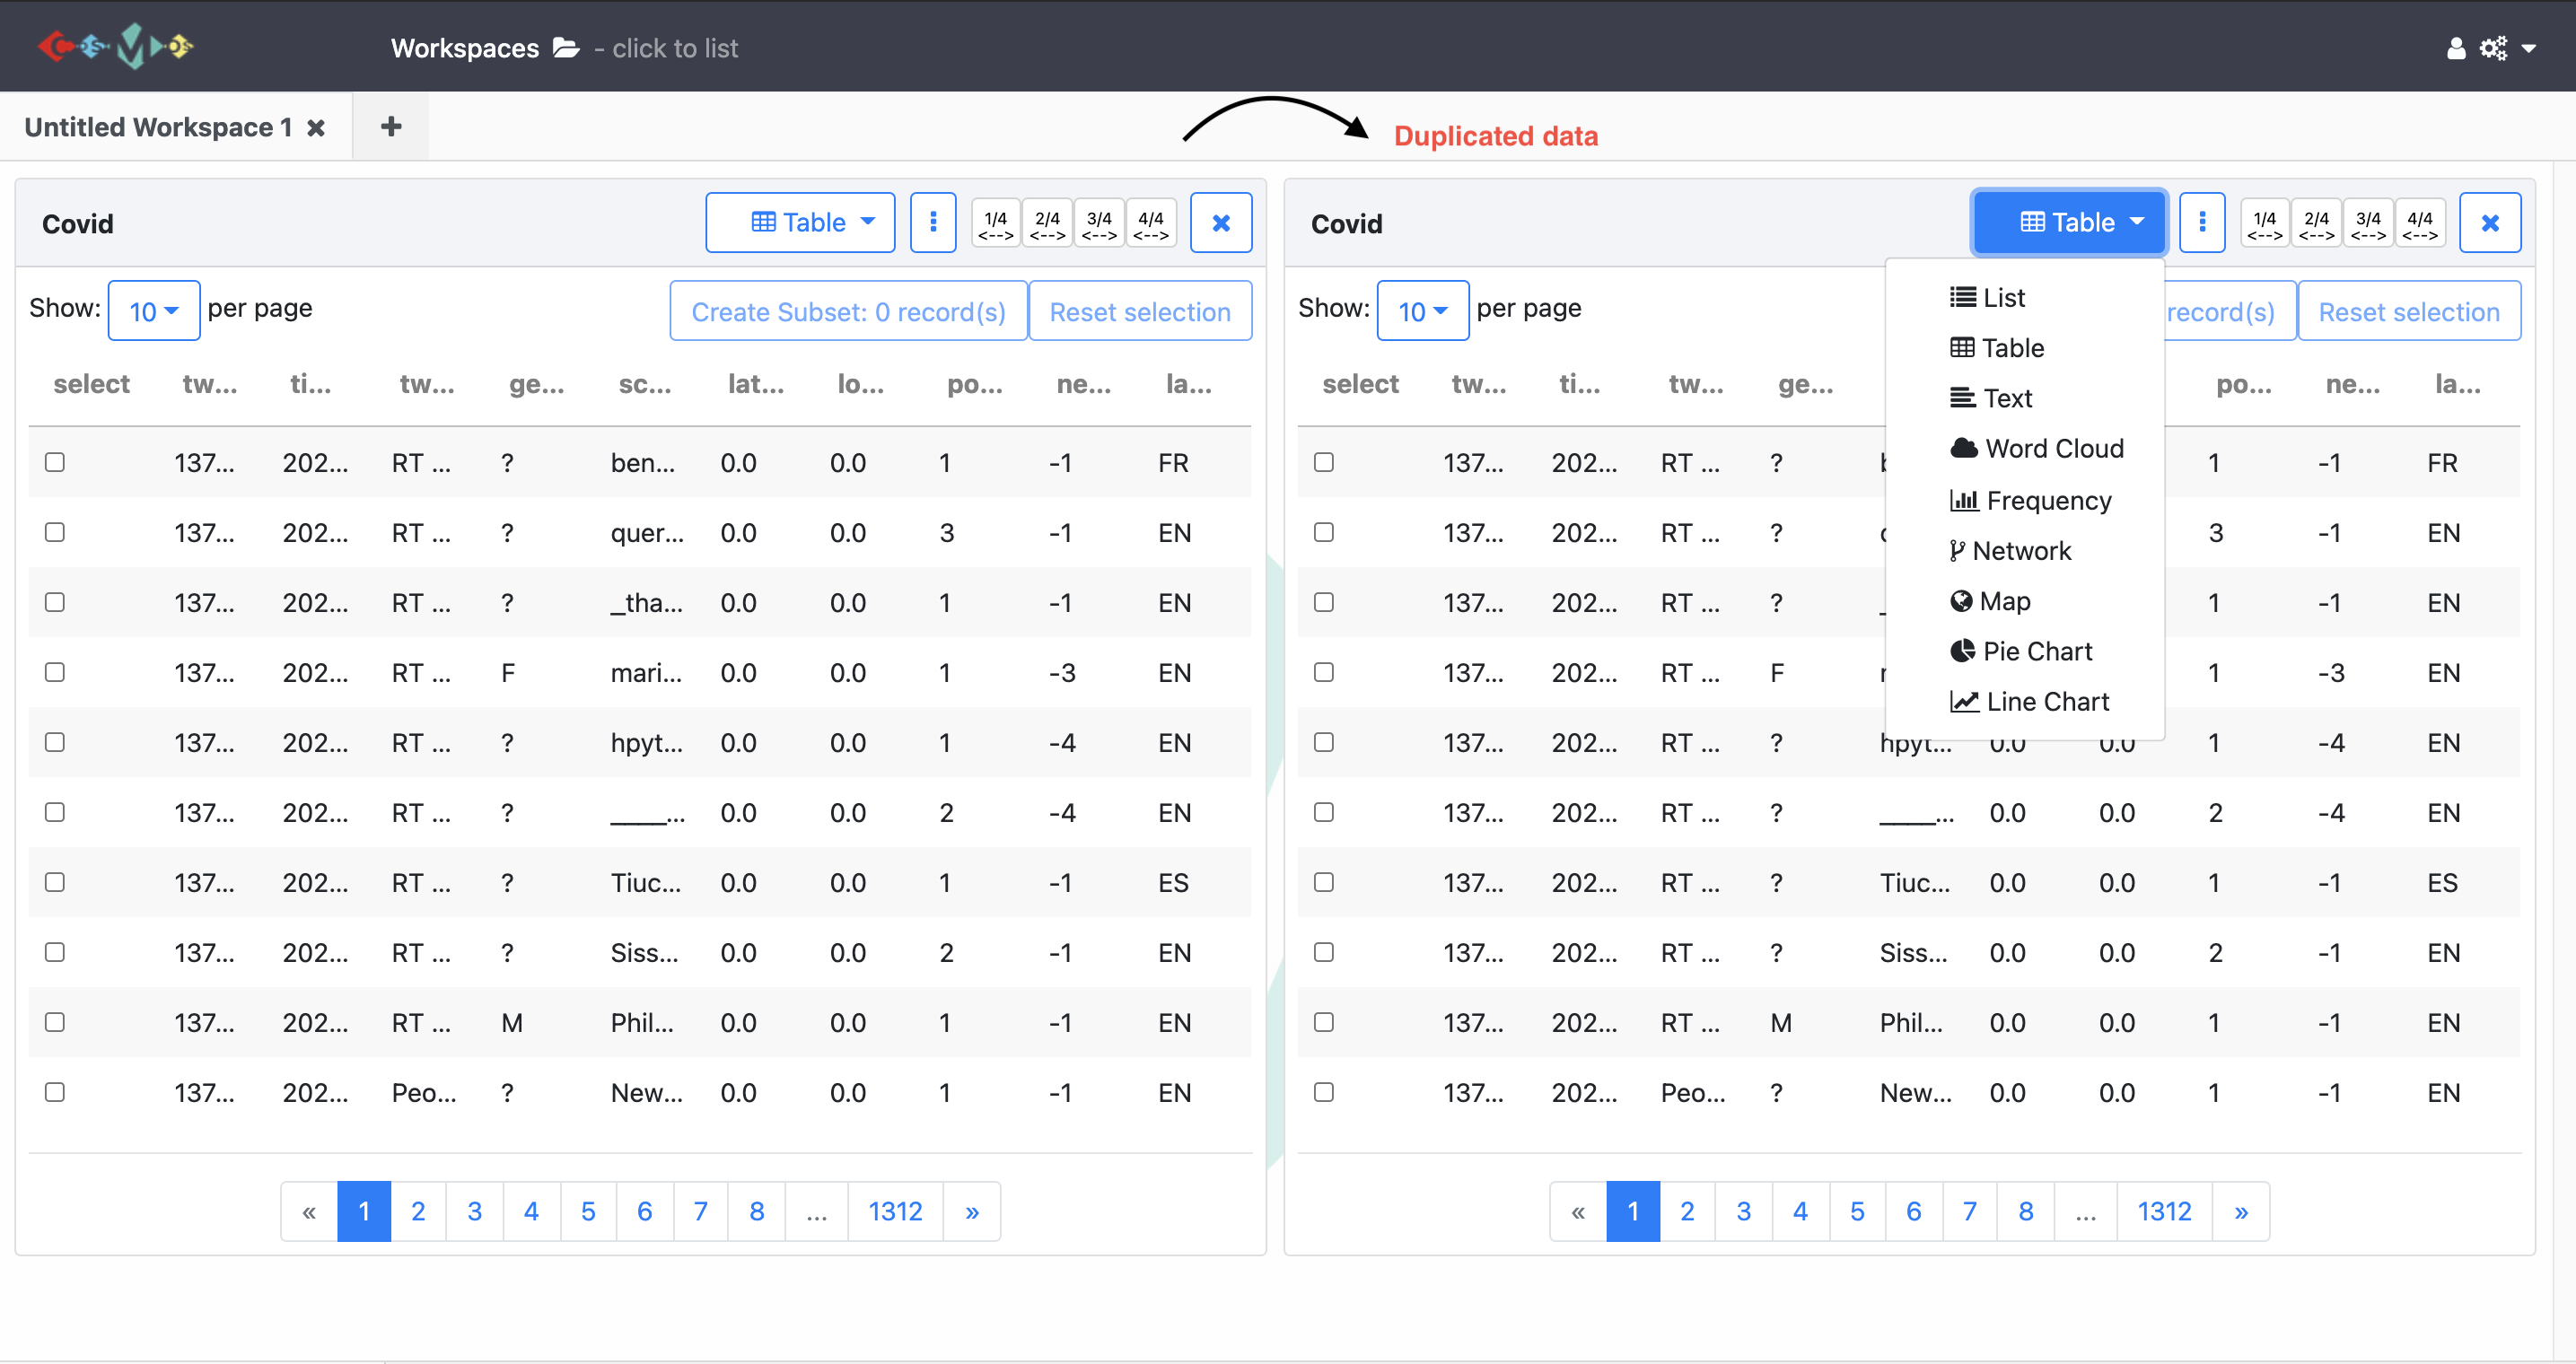
If you prefer to visualize different datasets, you need to create a new workspace by clicking the plus button near the workspace tab on the top of the page. Once you created a new workspace, the visualization steps will be the same.
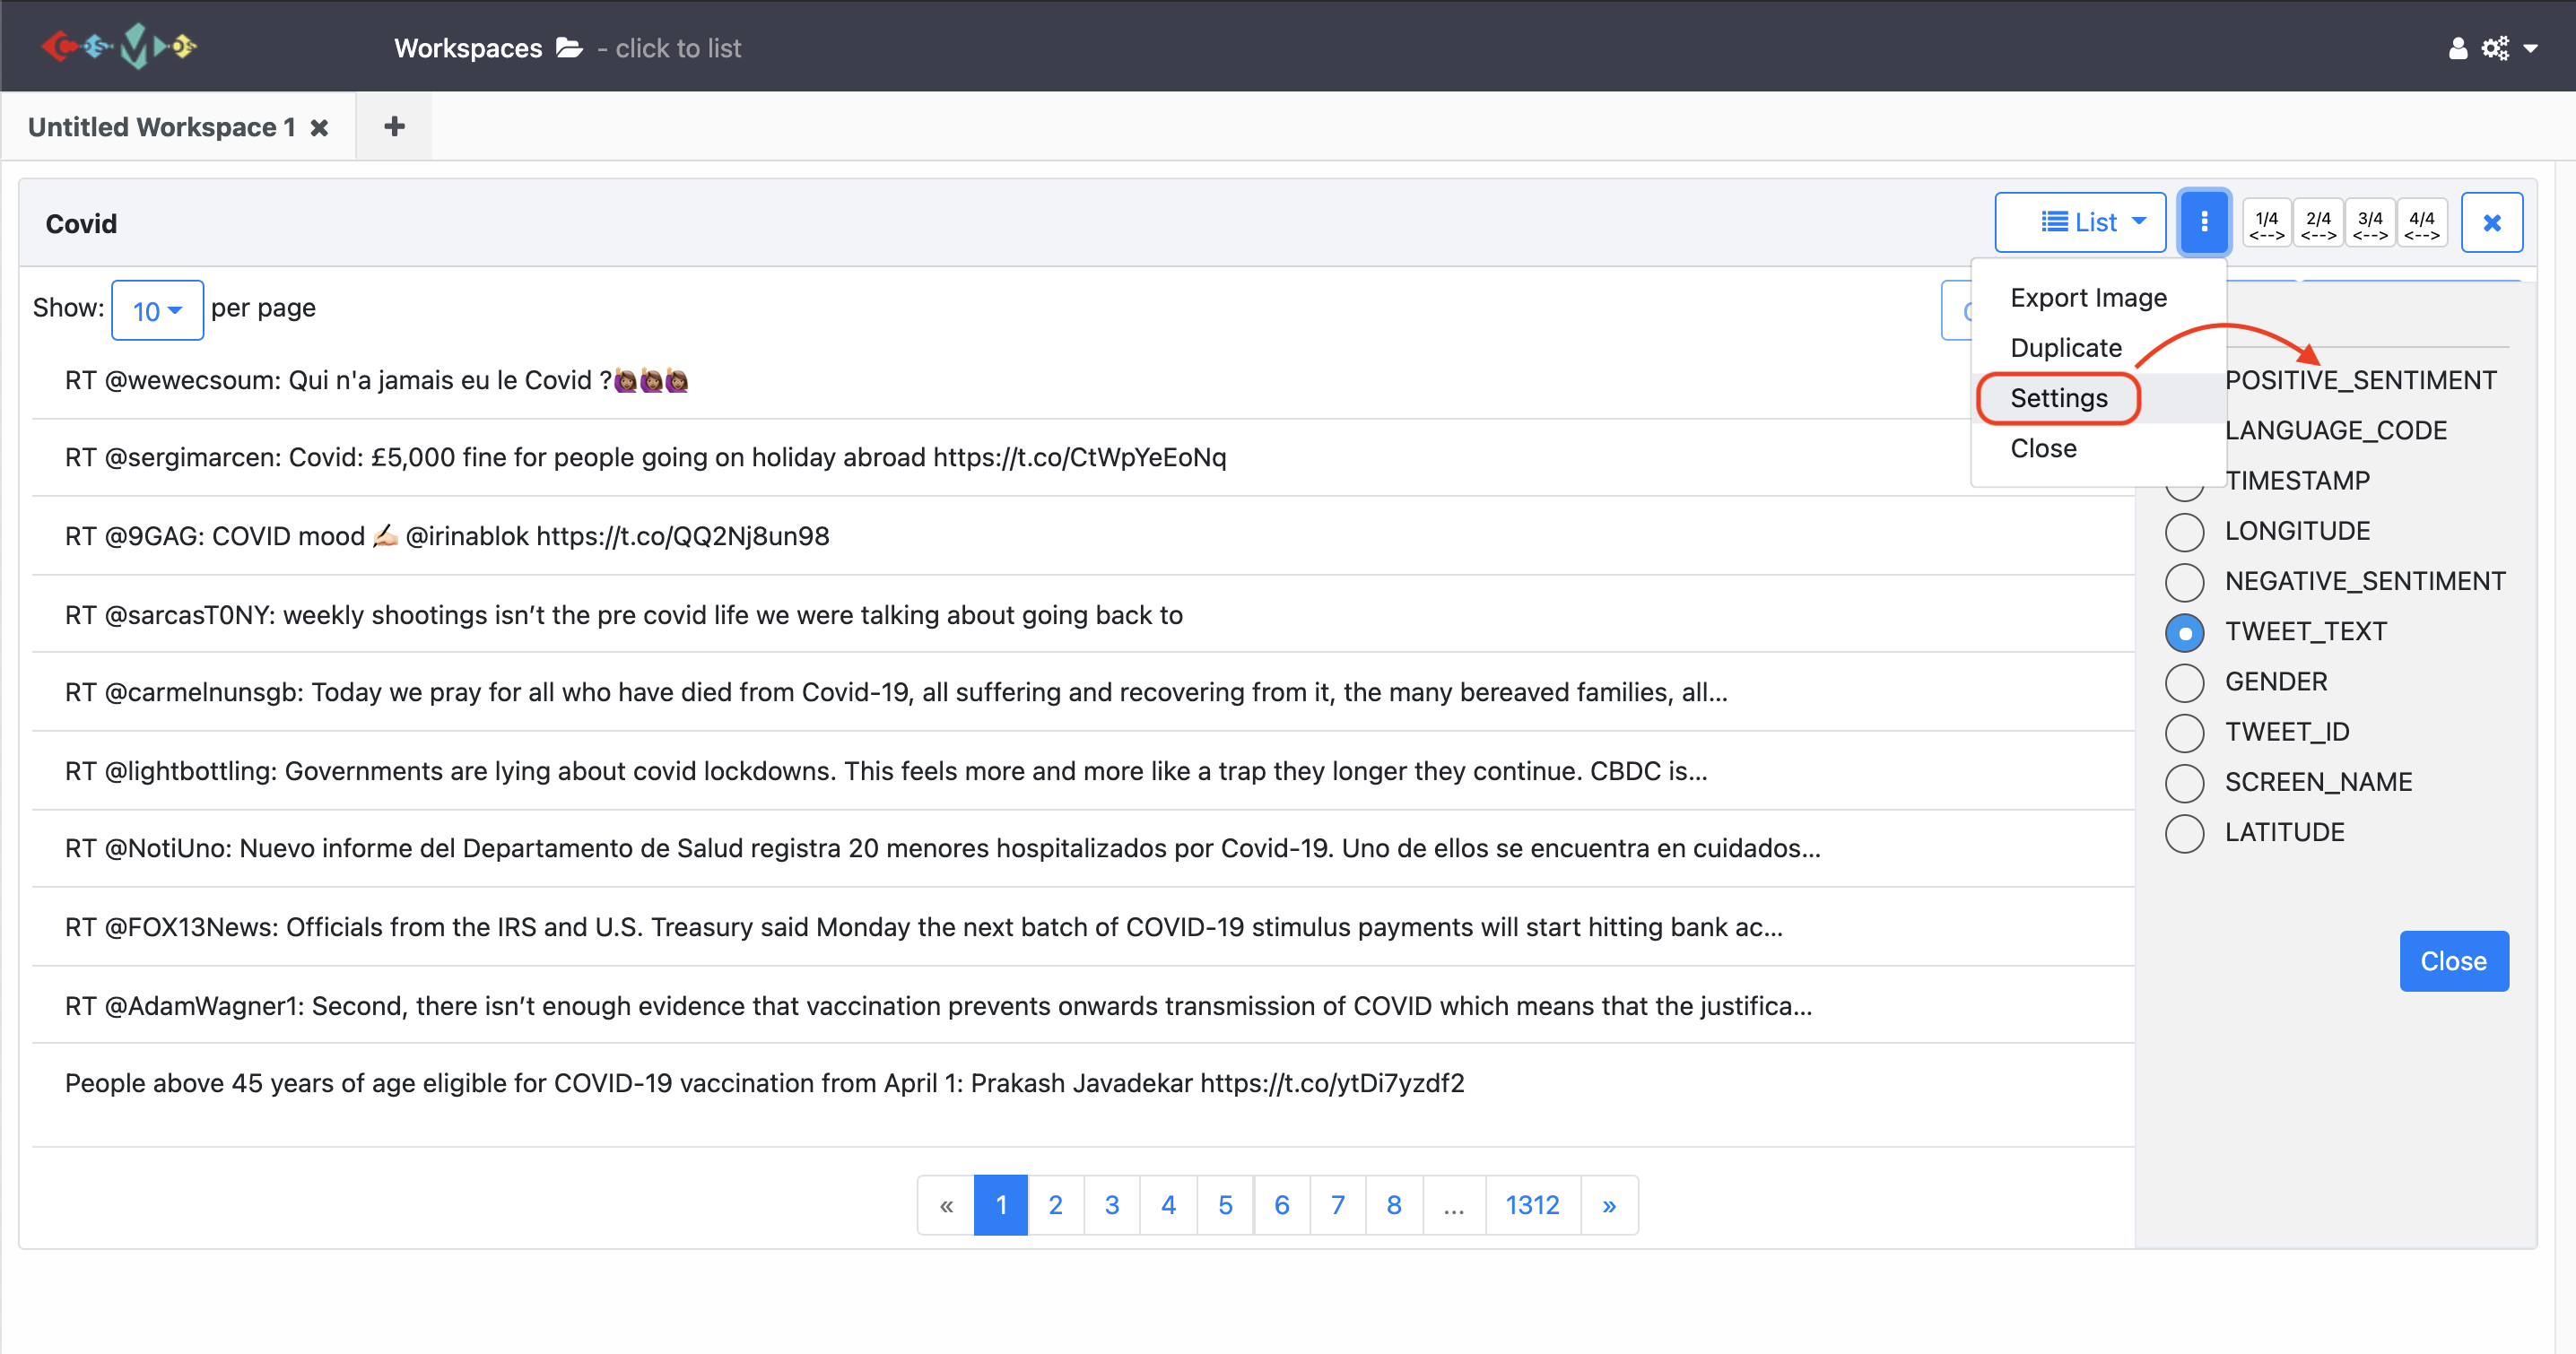
a) List
For the list view, you can create a list selecting type of meta data. To do that, click the 3 dots in the top of the right-hand corner and choose the Settings. Then, choose one of the option you need from the drop-down menu. See the illustration below:
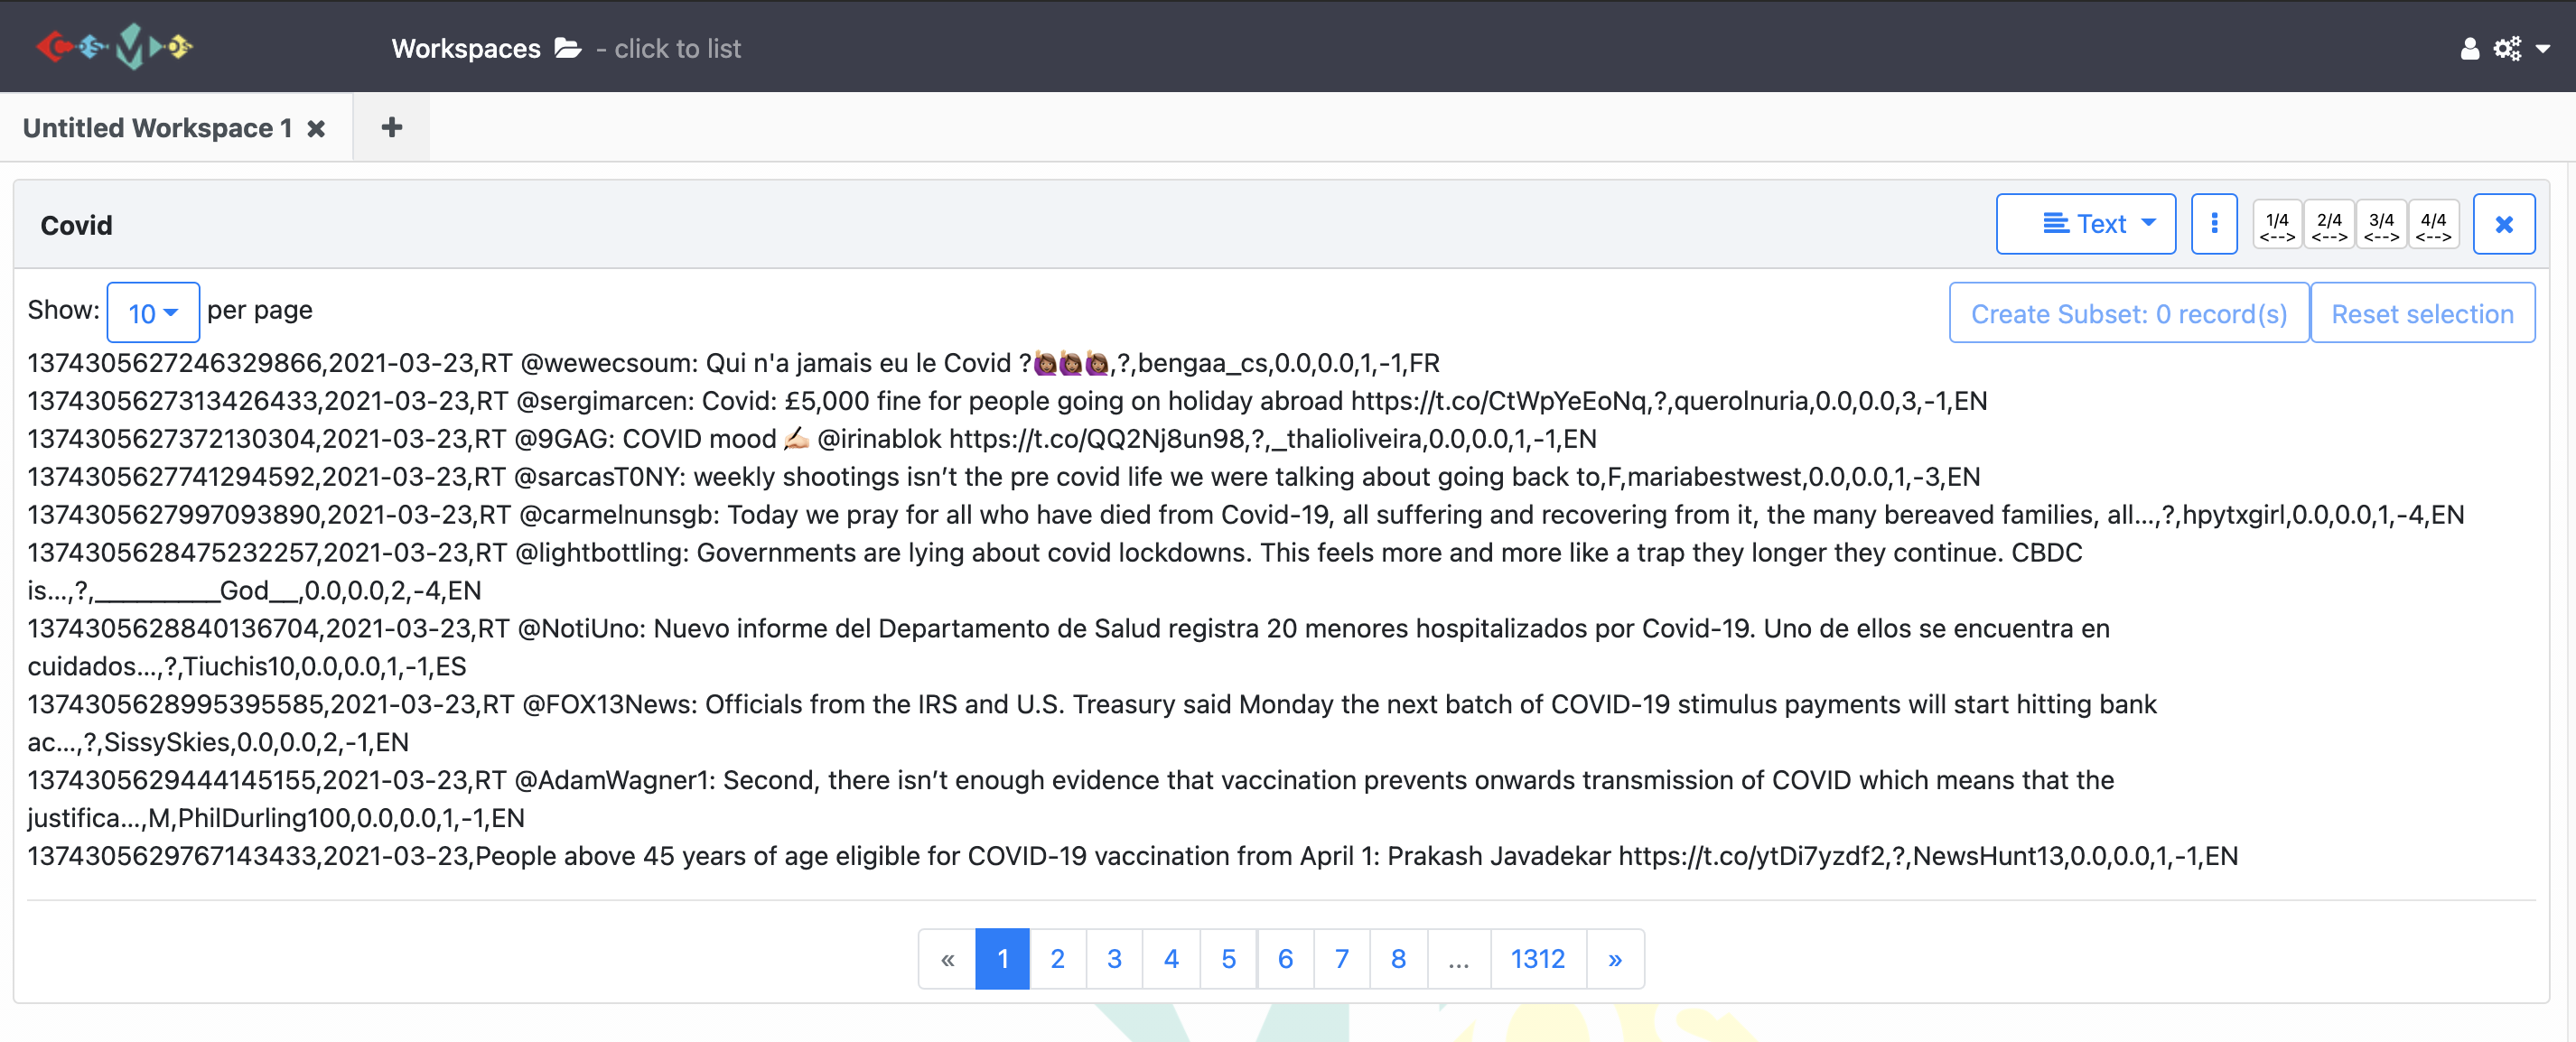
b) Text
Text view just demonstrates the text version of the metadata.
c) Word Cloud
For the word cloud view you can;
- select the number of the words that show up on the cloud clicking the little arrow at the top of the left-hand corner,
- (un)select tweets that contain a word by clicking on this word and create a subset dataset,
- exclude tweets that contain a word by
Ctrl(command) + clickon this word and create a subset dataset, - select the type of metadata you want to illustrate by clicking on
3 dots. ClickSettingand select any entity by clicking the radio button. Once you have made a selection, the word cloud will be created based on this entity.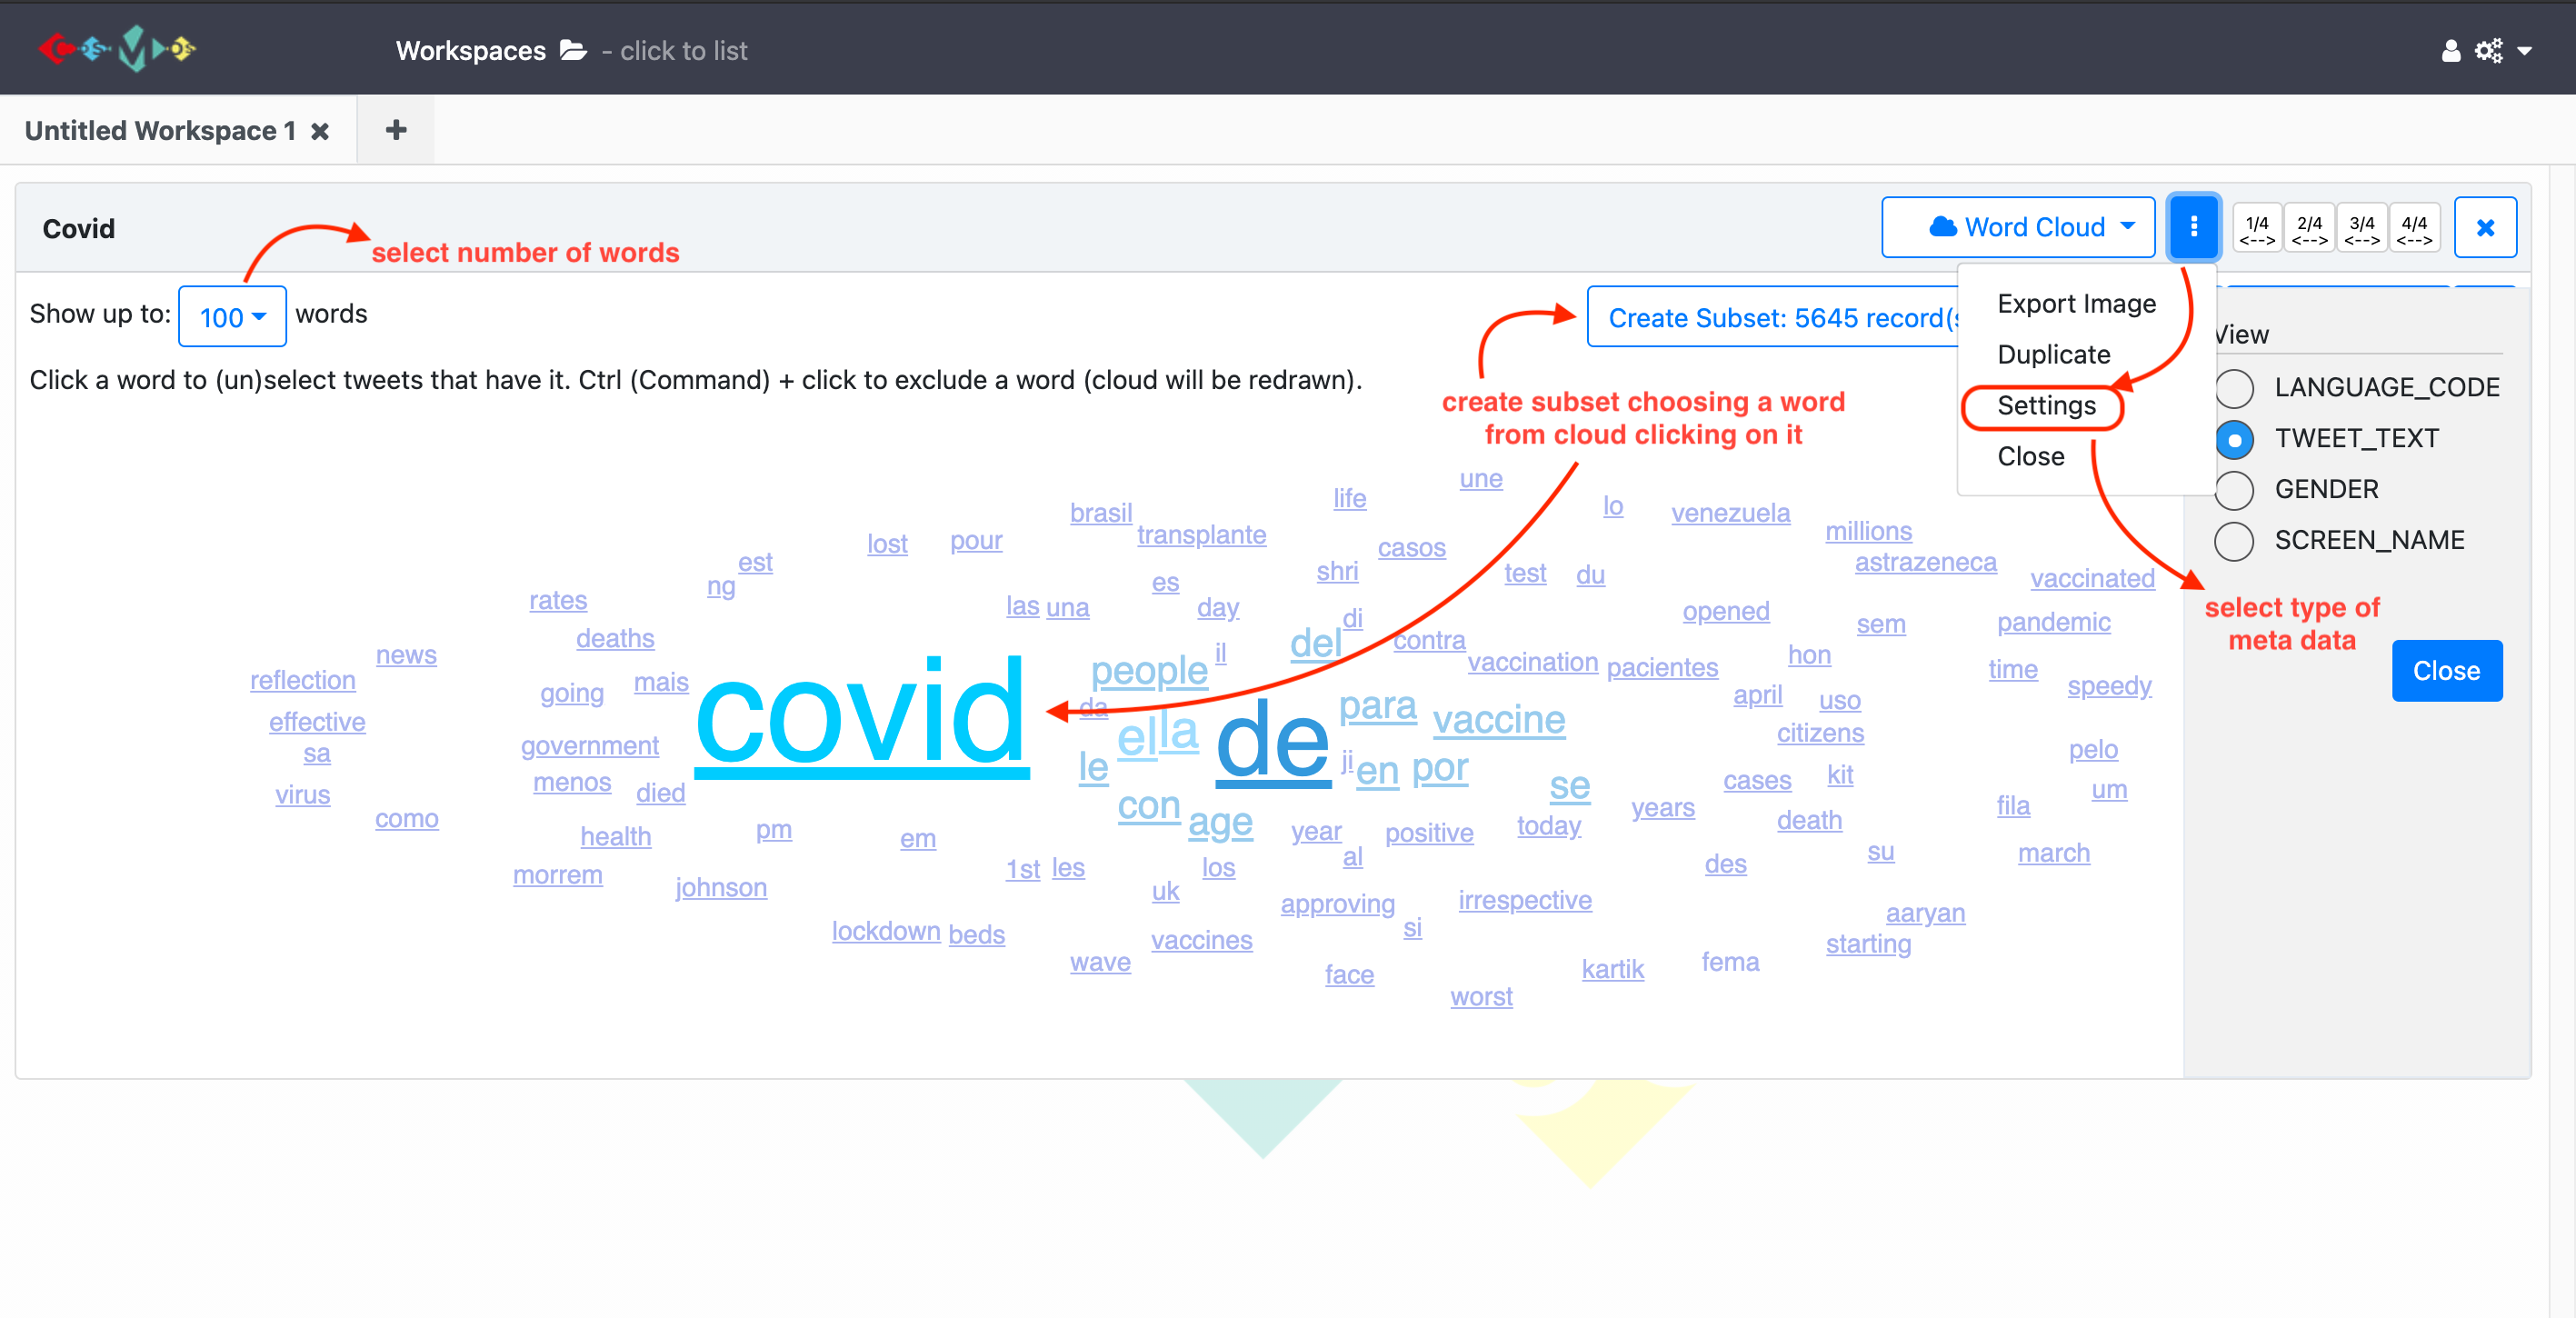
d) Frequency
There is a separate lesson for frequency view. (See lesson 6)
e) Network
There is a separate lesson for frequency view. (See lesson 6)
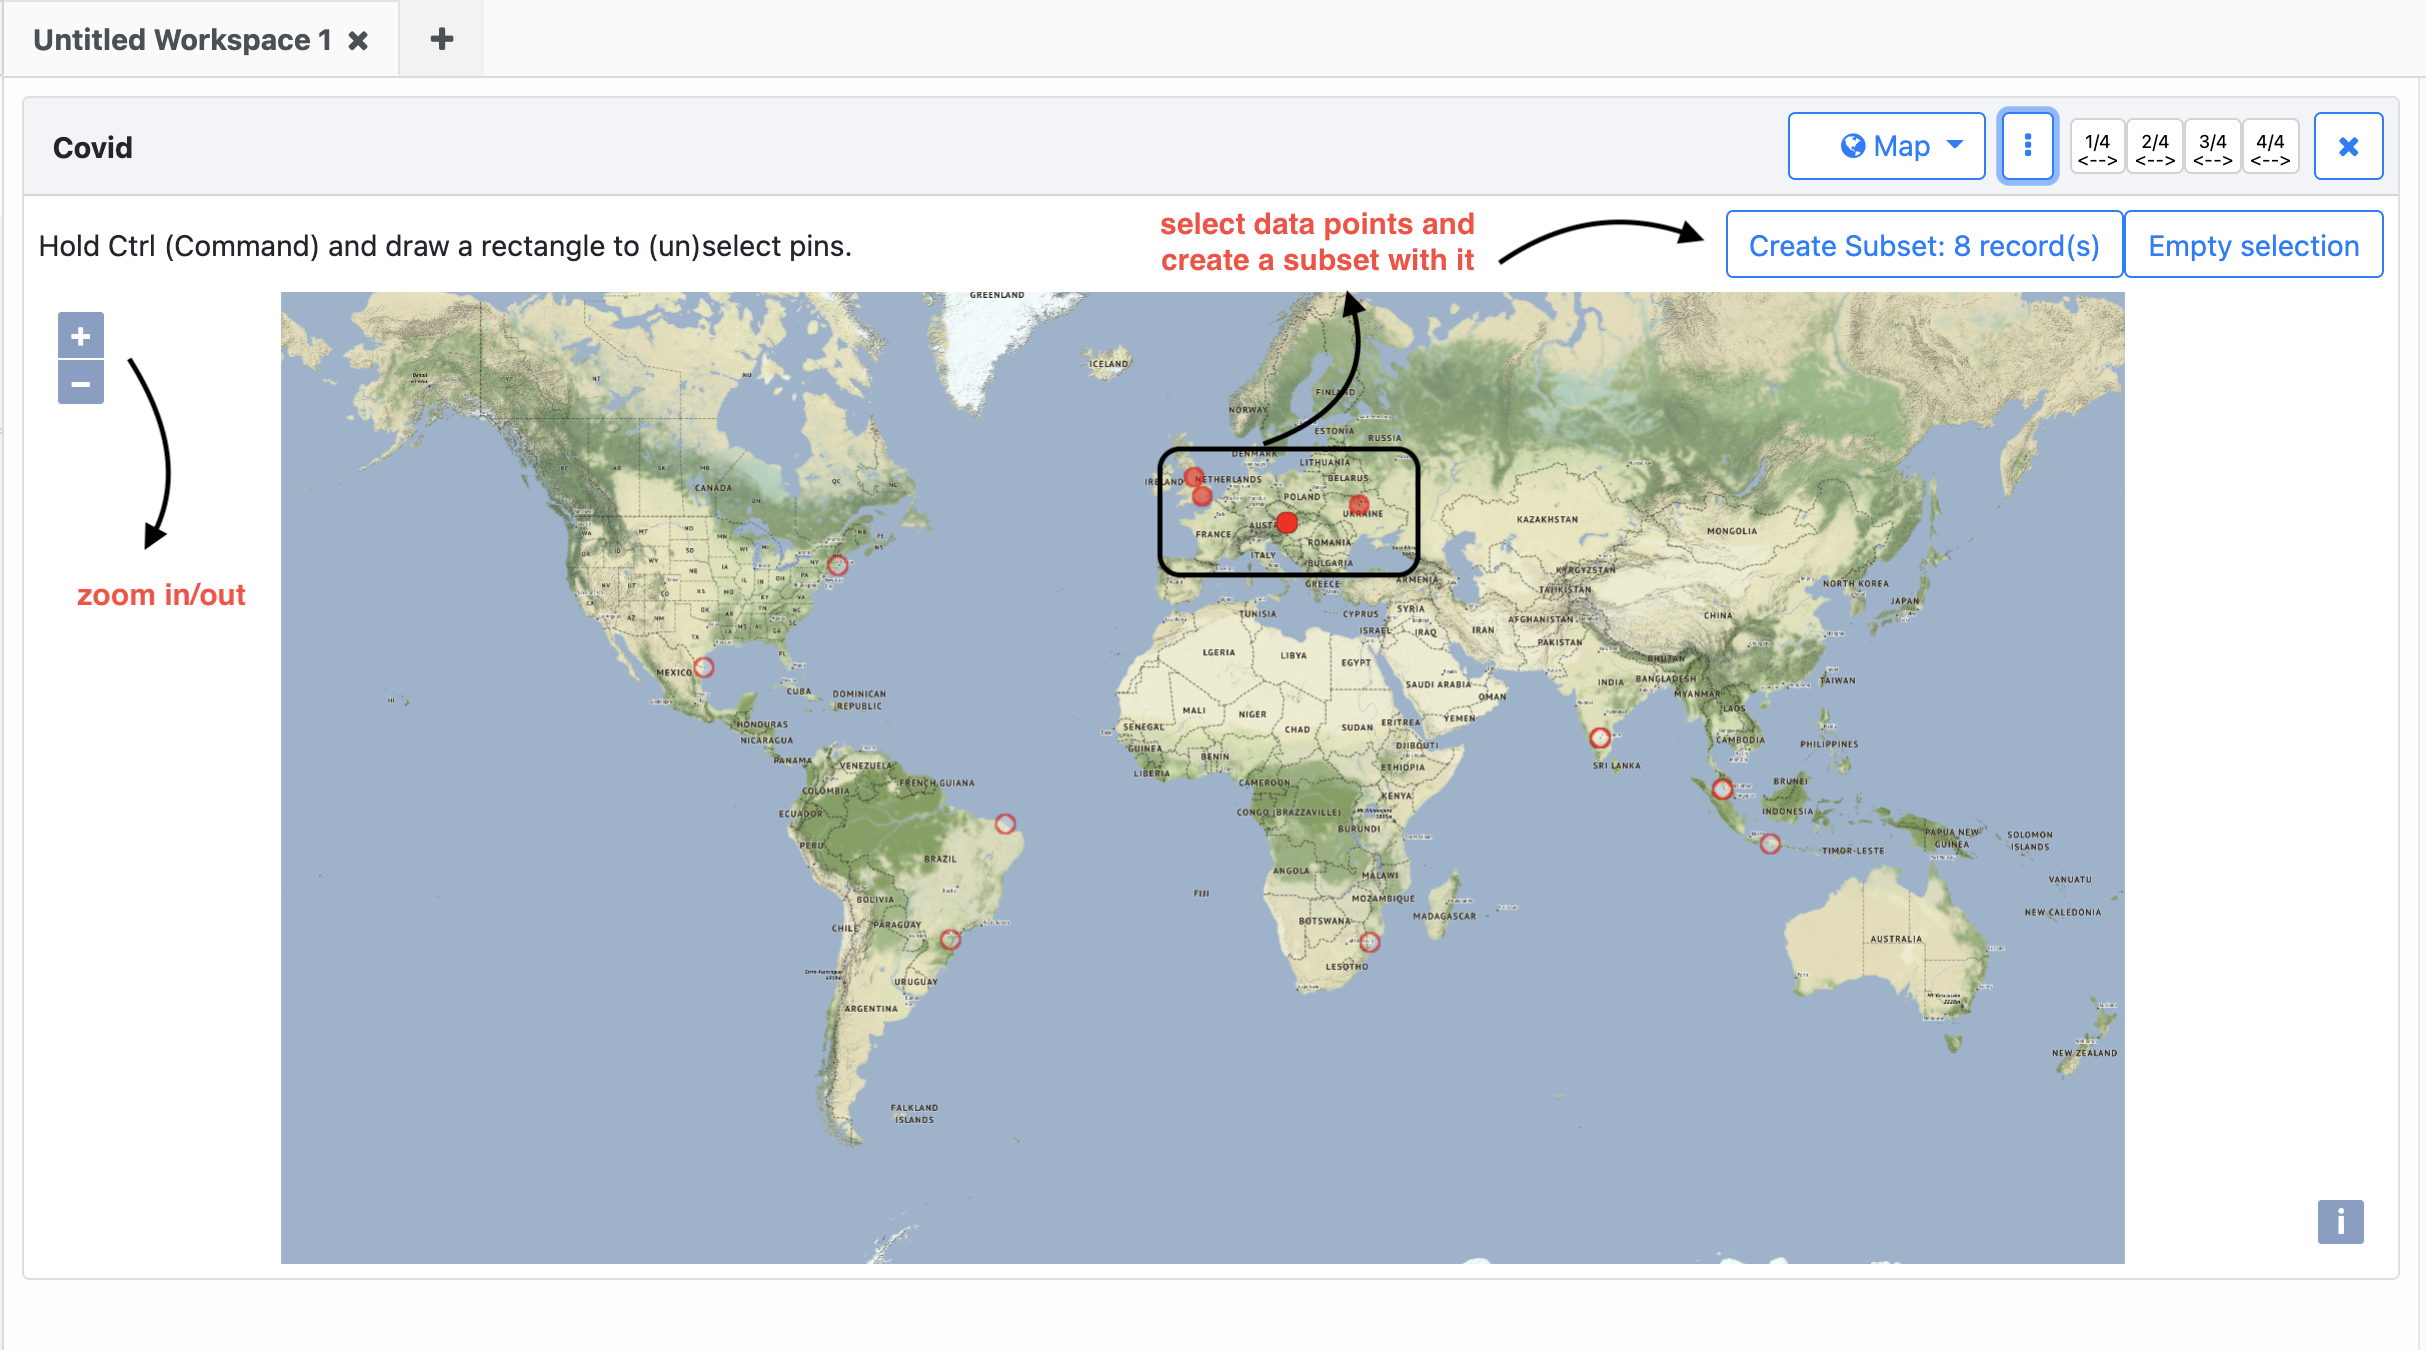
f) Map
Tweet geospatial metadata has been used to create the map view. COSMOS visualizes geographic data points on the map based on tweet location (if it is specified by the user). The map view can be used to identify hotspots of tweets within the collection. You benefit from this view to monitor and map the spread of social movements such as specific events, occasions, disease outbreaks, etc.
For the map view you can;
- Visualize geographic data points on the map based on the location of tweets posted.
- To select data points on the map ‘Hold Ctrl (Command) and draw a rectangle to (un) select pins’.
- Create a subset with these selected points.
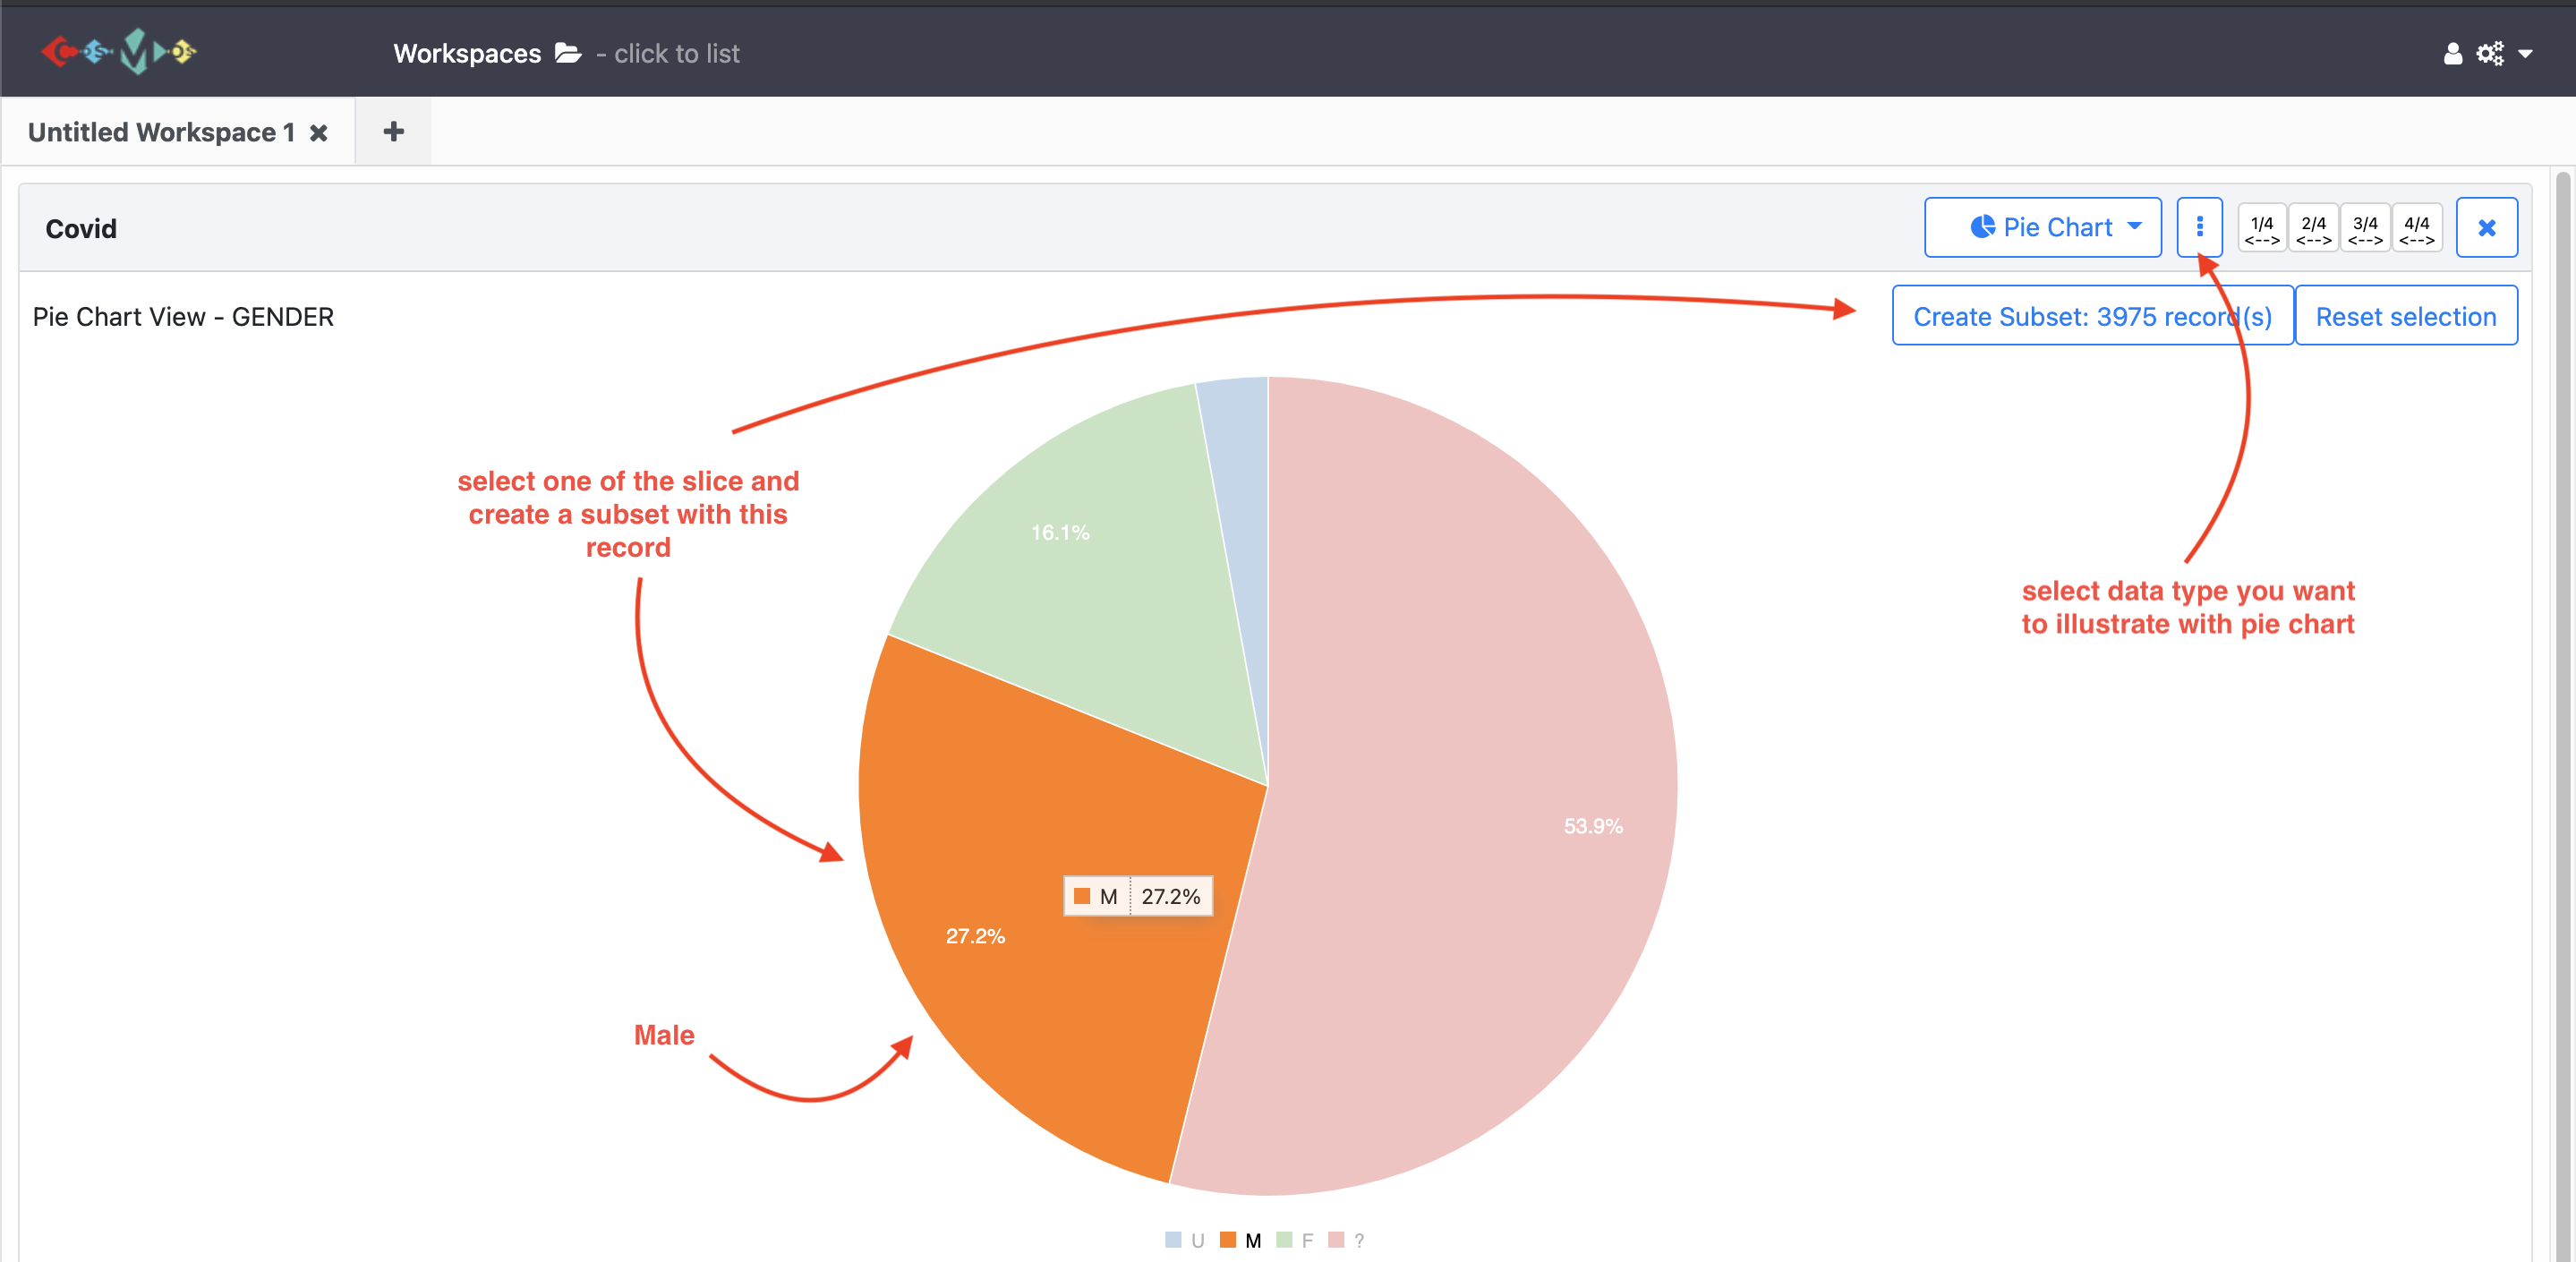
g) Pie Chart
For the pie chart view you can;
- select the type of metadata you want to illustrate by clicking on
3 dotsand thenSettings, - click one of the slices on the pie chart and create a subset for this group.
- see the percentage of each group represents.
i) Line Chart
For the line chart view you can;
- specify the y-axis of the line chart base on the metadata.
- create multi-line charts to represent and compare more than one series in the dataset.
You can also watch youtube video clicking the image below for all data visualization process with COSMOS.
Exercises
- Create a pie chart representing
negative sentiments. Then, create and name a subset data set for the group of tweets that has a sentiment score is ‘-3’.- Visualize your data collection using the
Word Cloudview showing up to 50 words. Then, create and name a subset including one of the most used words inTwitter text.- Create a multi-line chart representing
positive sentimentandnegative sentiment.
3. Drilling down into data
COSMOS provides many ways to create and visualize subsets regarding research needs.
1. Query
After enough data has been collected, clicking the three dots on the show panel you can filter data collection based on tweets sentiment, date, gender, language and country.
2. Create a subset from the collection
While the collection continues, clicking the three dots on the show panel, Snapshot the collection to create a subset data which has been collected until the snapshot.
3. Create a subset from the visualizations
After creating and naming a subset from any visualization view, you can apply the same visualization steps to the subset data you recently created. It allows examining and comparing the data in details. See the video tutorial for this lesson below:
More on Visualizations
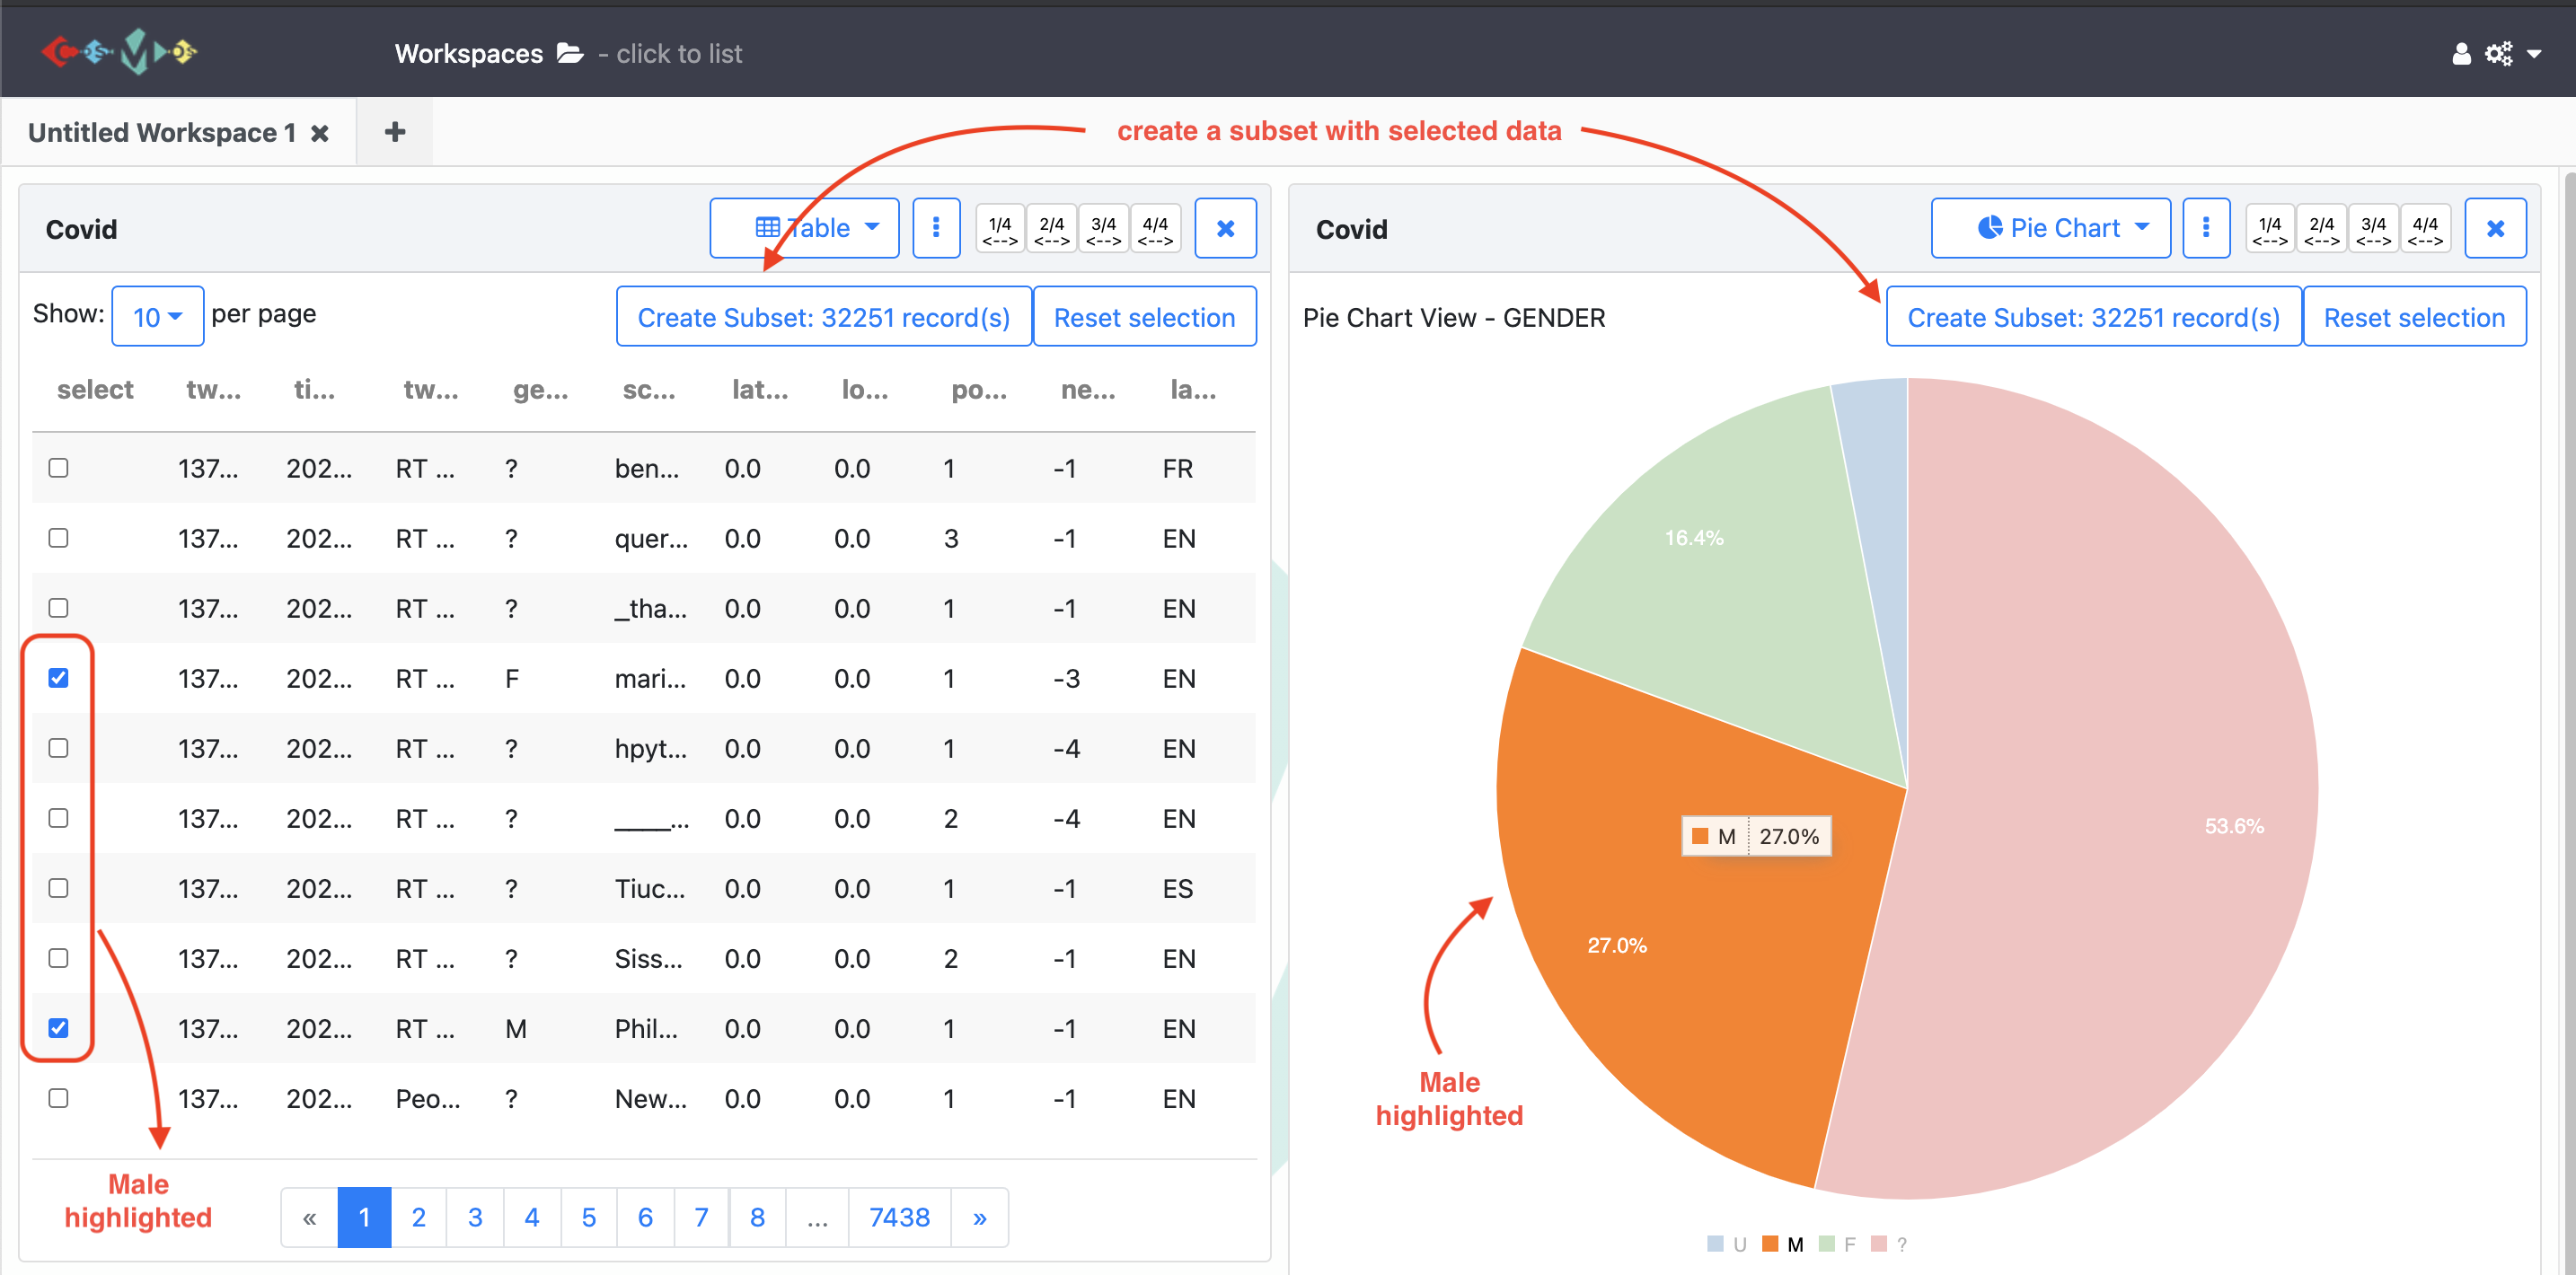
Once you create more than one visualization, selecting data in one view highlights the same data for other views.
For example;
let’s say we created one table view and on pie chart view. When we click on one of the pie chart slices (female one), it highlights female tweets on the Table view.
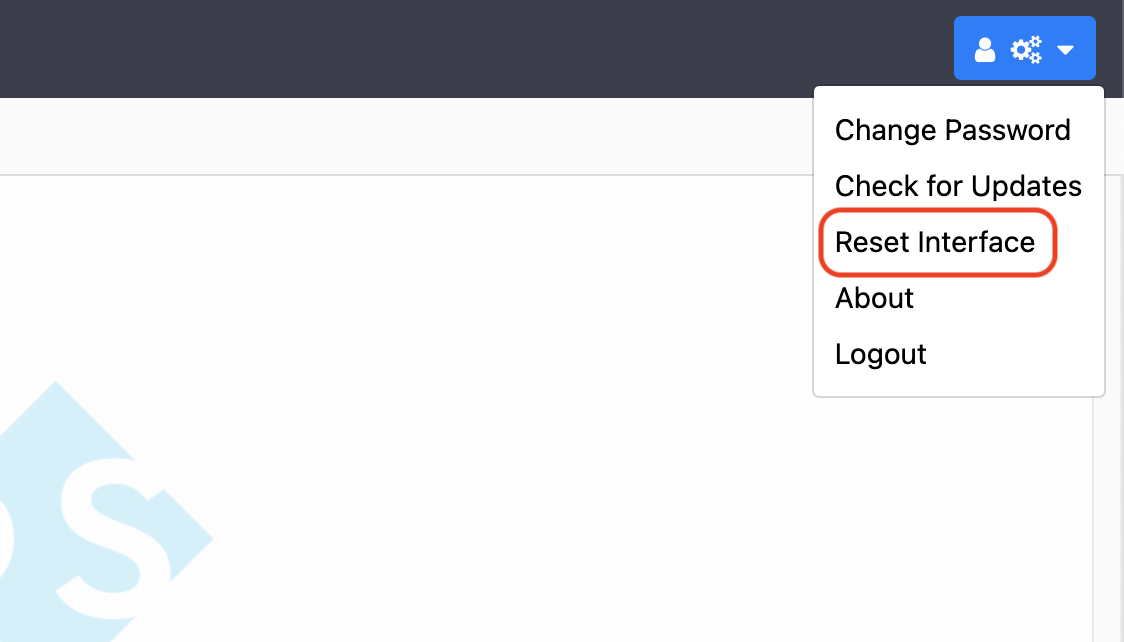
Tip:
If it takes too long to create one of the visualization views:
- Click on the menu icon on the right top corner of the page and select
Reset Interface.- Then, try to create the graph again.
You can also watch youtube video clicking the image below for all data analysing process with COSMOS.
Exercises
- Collect
100,000tweets with the keywordscovid,covid19,coronavirus.- Create a subset for tweets posted from Europe using one of the visualisation methods and call it
Europe.- Create another subset from
Europefor tweets posted by female users and call itfemale.
Key Points
COSMOS provides ways to demonstrate and analyse Twitter data.
Frequency and network analysis
Overview
Teaching: 10 min
Exercises: 5 minQuestions
How do we use network and frequency views in the COSMOS?
Objectives
Understanding frequency and network analysis with COSMOS.
Lessons
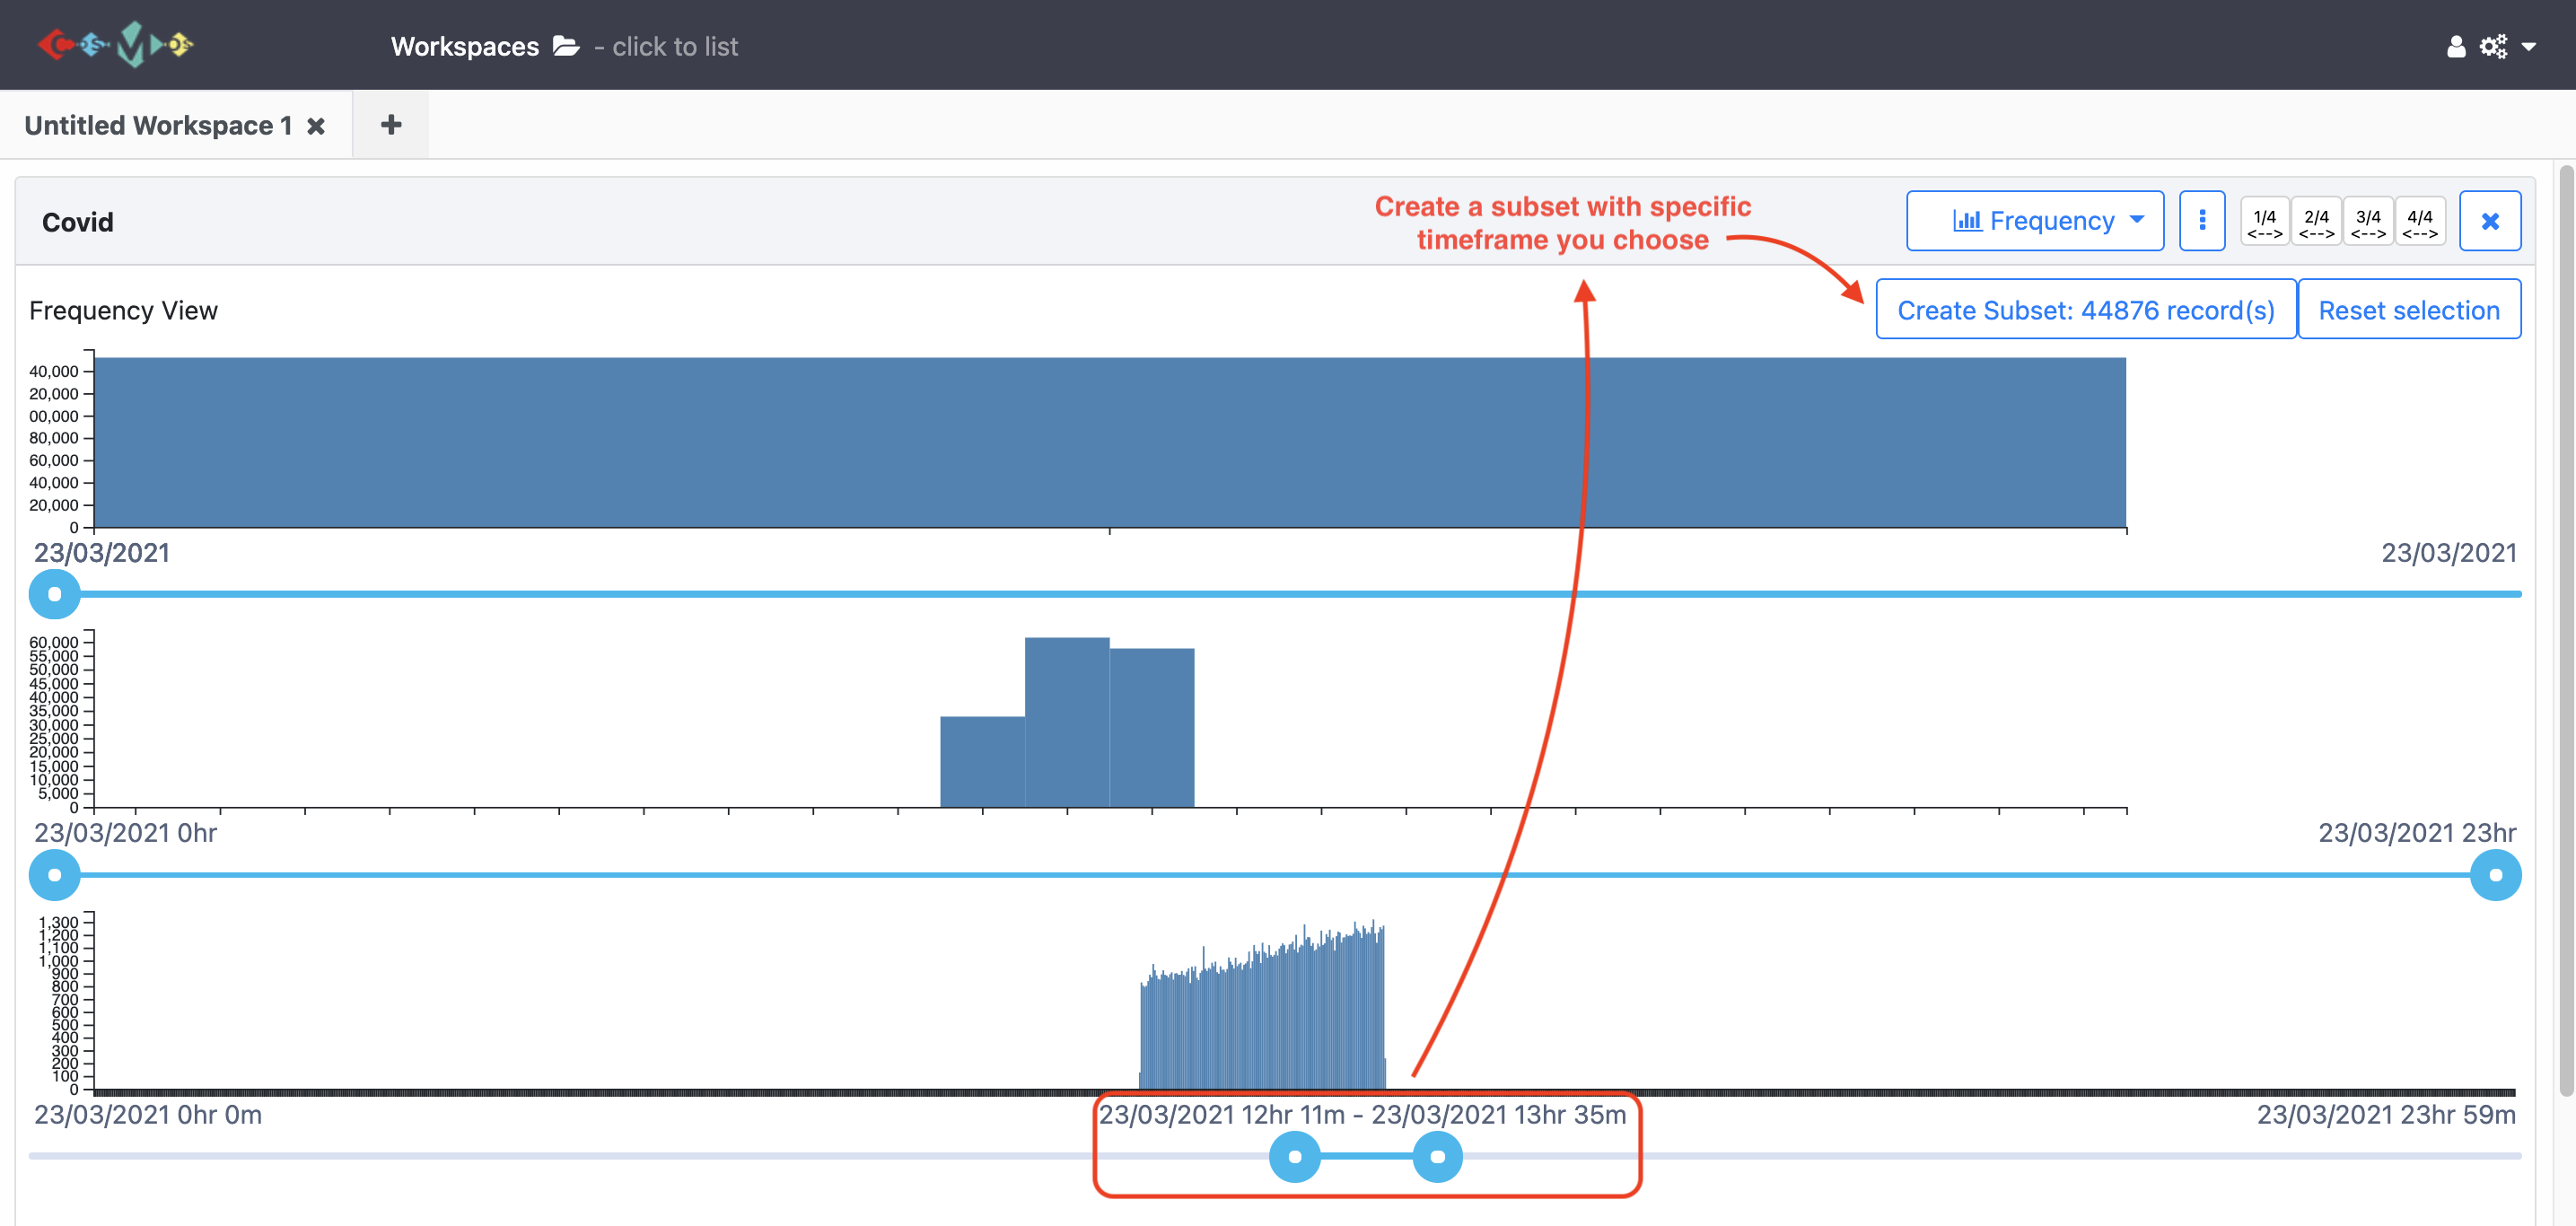
1. Frequency Analysis
In the frequency view, COSMOS provides 3 types of frequency analysis on a daily, hourly and minutely basis. You can change the time interval by clicking the slider underneath each graph. This view helps to spot tweet spikes over time easily. Chart sliders can be used to create a subset of data around these spike dates.
See the example of frequency view below:
You can also watch a youtube video by clicking the image below for all frequency processes with COSMOS.
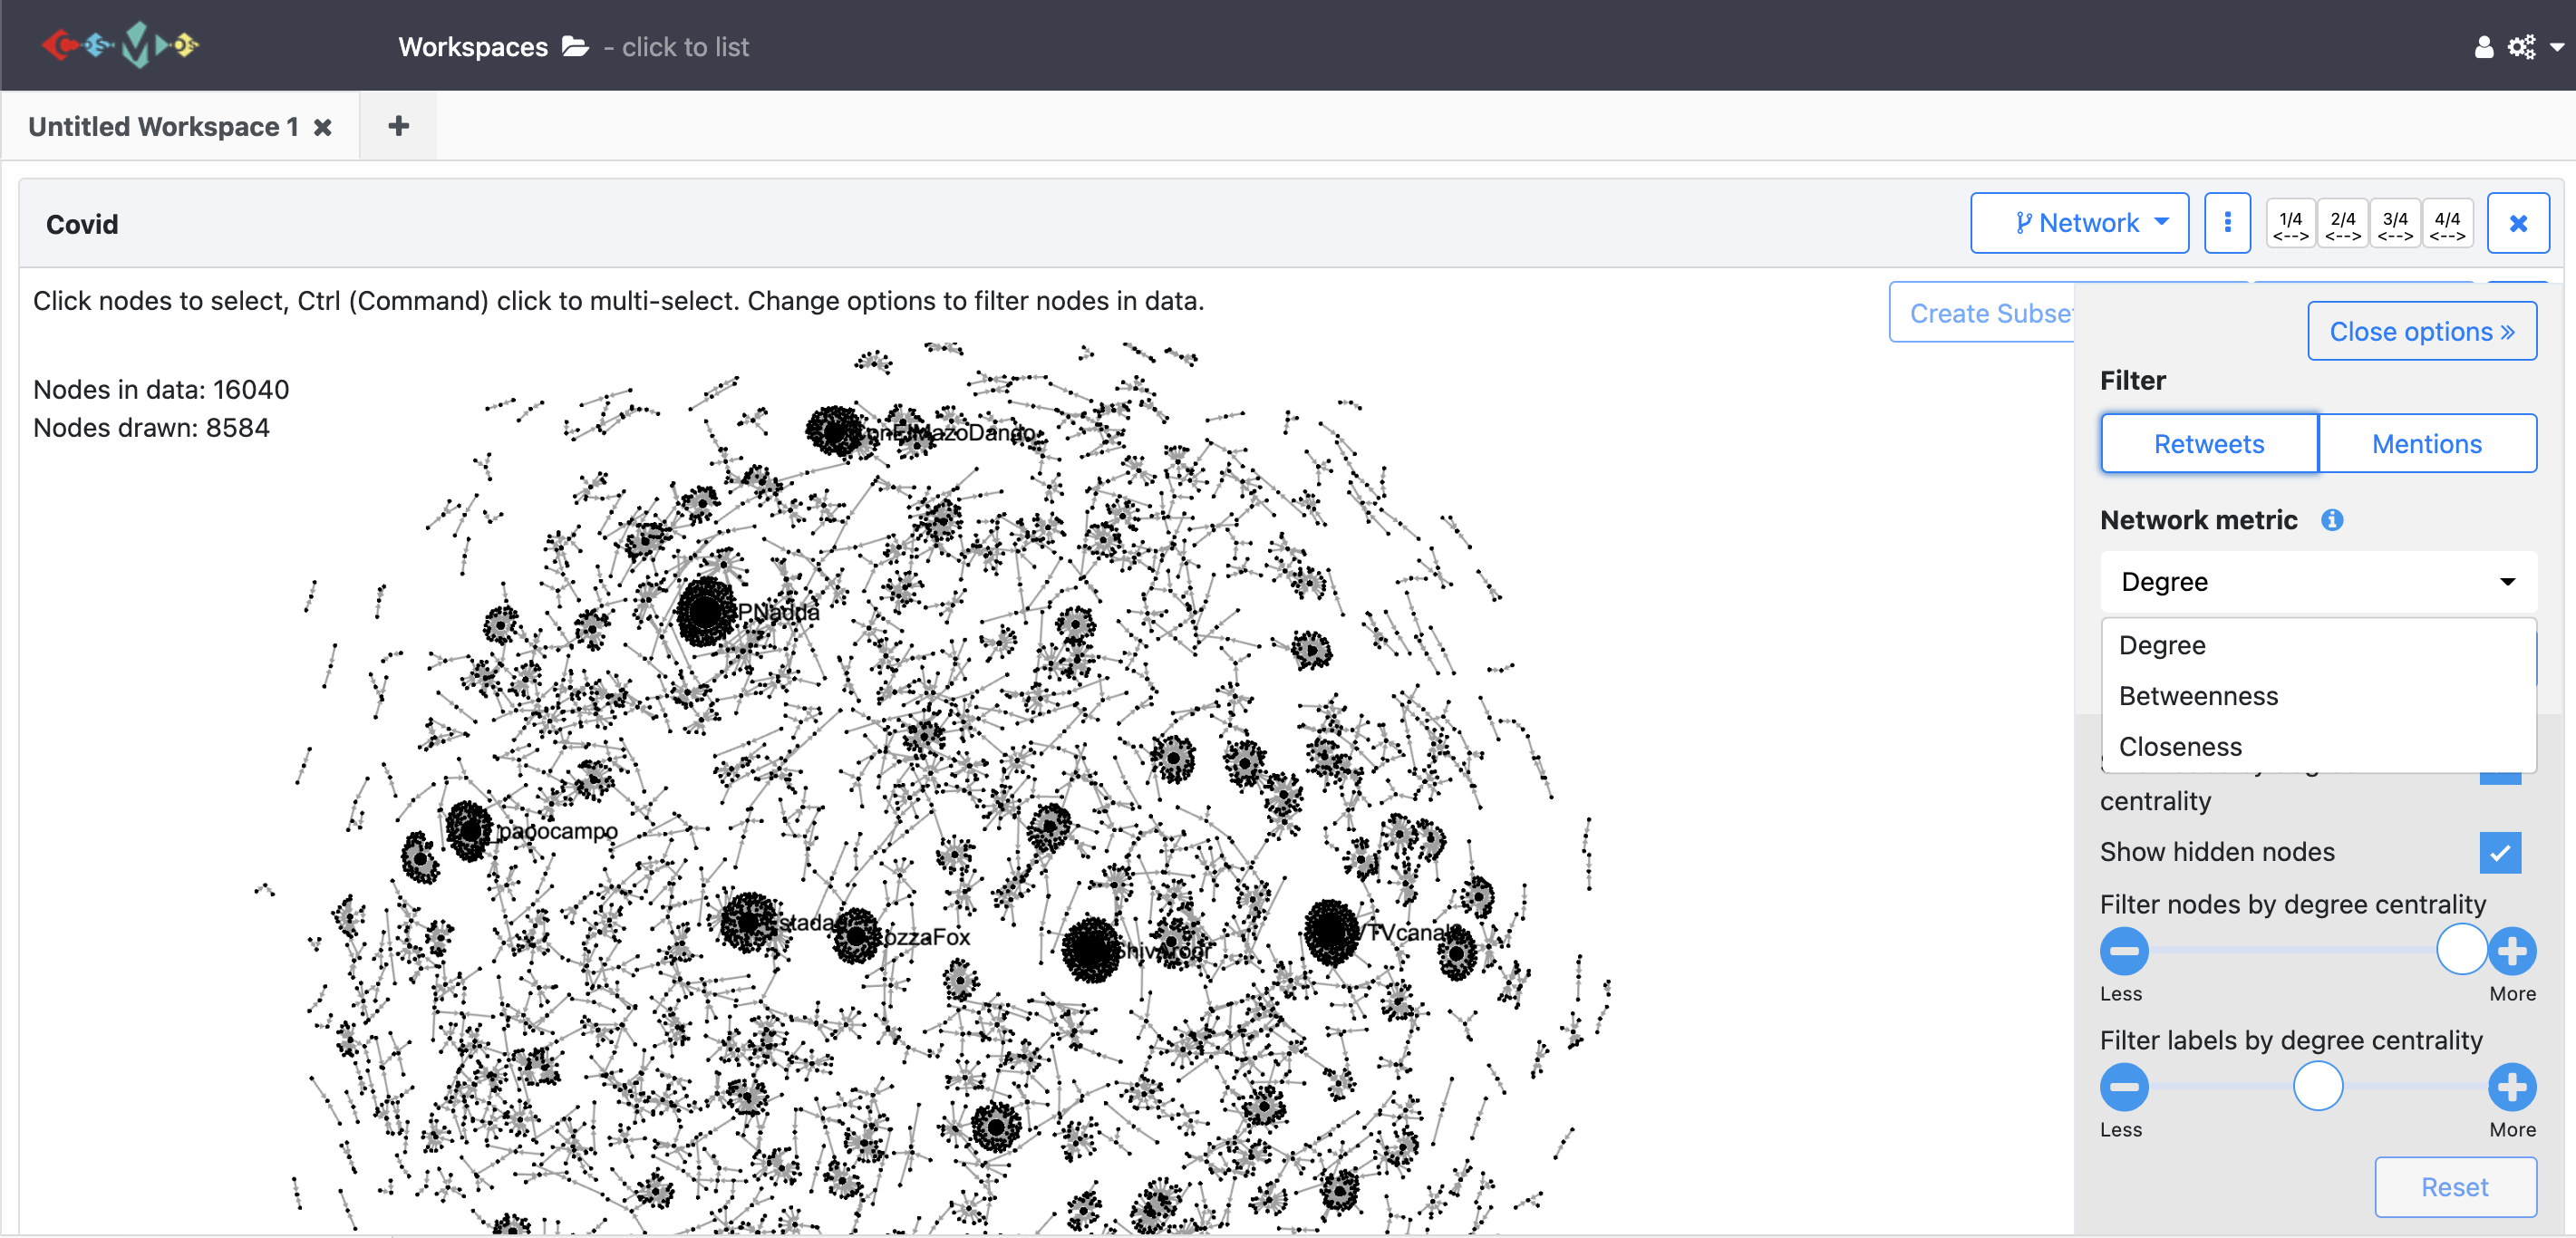
2. Network Analysis
COSMOS provides network analysis with Twitter data. It can currently be used to visualize retweets and mentions networks.
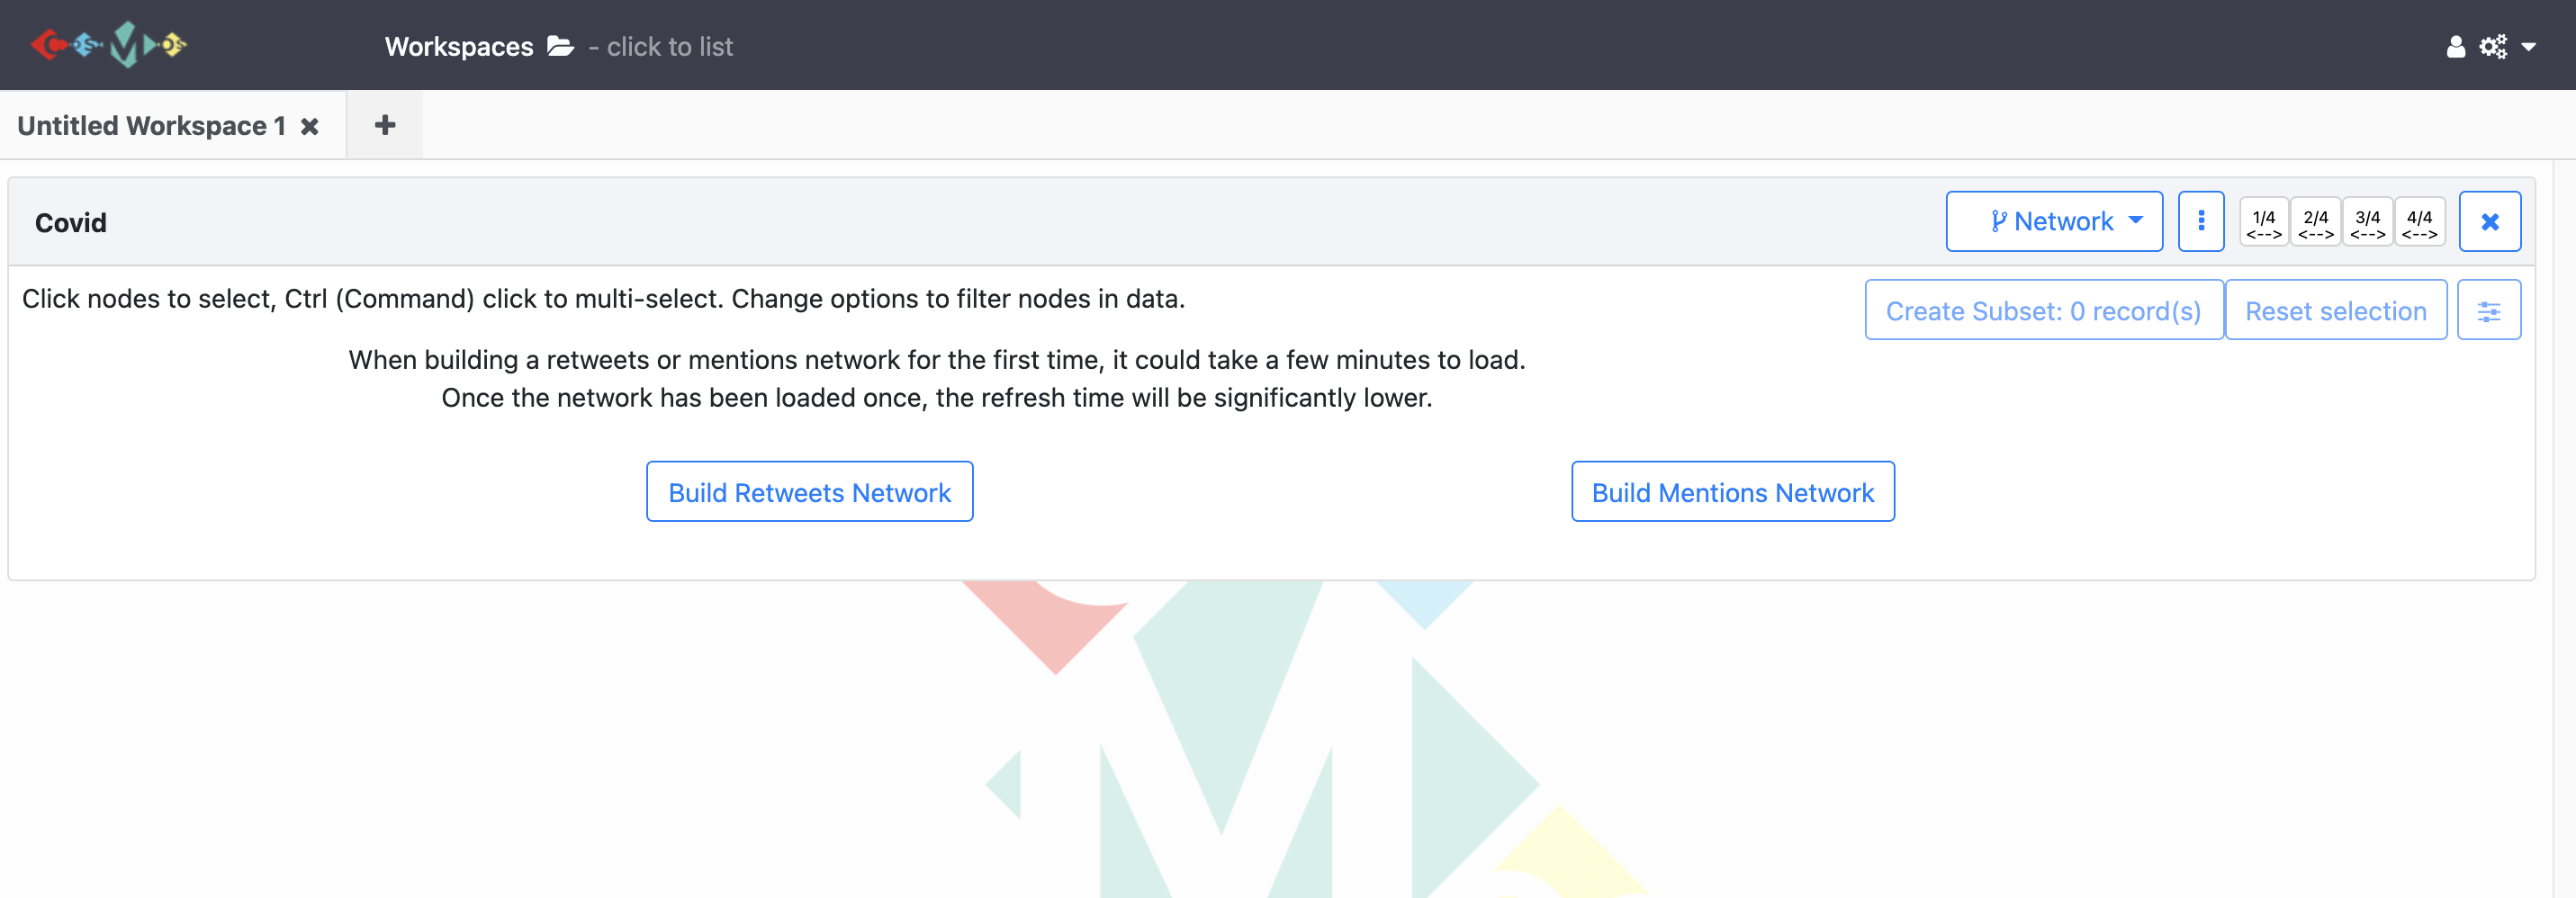
These network views aim to identify prominent users and their level of influence in the network. They also show information flows in social media e.g. thoughts of prominent users on a particular event, topic or product. Both views (retweet and mention) help to visualize the connection and interaction between users. Network graphs can be created based on the network metrics degree, closeness and betweenness. Network metrics can be selected from the drop-down menu on the right-hand side of the page. COSMOS also gives the filter option to adjust nodes and label visibility on the network chart. Using the sliding chart on the right panel, you can adjust how the network chart looks.
Similar to other views in COSMOS, you can create subsets ‘Ctrl (Command) + Click’ on multiple nodes to focus on and deeply analyse the network for specific accounts.
You can also watch a youtube video by clicking the image below for all frequency processes with COSMOS.
Exercise
Create a subset of a collection that contains at least 2 users that affect the network for a specific event.
Key Points
COSMOS provides frequency analysis with Twitter data to help us analyse and draw conclusions.
COSMOS provides network analysis that gives the opportunity to understand social network structure, the role of key players, communities, etc…
Adding RSS Feeds
Overview
Teaching: 10 min
Exercises: 5 minQuestions
What is an RSS Feed?
How to add RSS Feeds to COSMOS?
Objectives
Adding RSS Feeds to COSMOS.
Lesson
What is an RSS Feed?
- An RSS Feeds is a technology that allows users to access updates to the website in a computer-readable format.
- Websites which publish episodes, news, blog posts or episodes of video series use RSS Feeds.
- With RSS Feeds, users do not need to check websites manually for new content.
- Further information can be found by following the links below:
https://www.digitaltrends.com/computing/what-is-an-rss-feed/
Once COSMOS is launched in your browser, click the plus button on the top left corner. There are options Import Data, Import RSS Feed and Start Twitter Collection. We will importing an RSS Feed on COSMOS:
- Click
Import RSS Feedand the popup window appears on the page.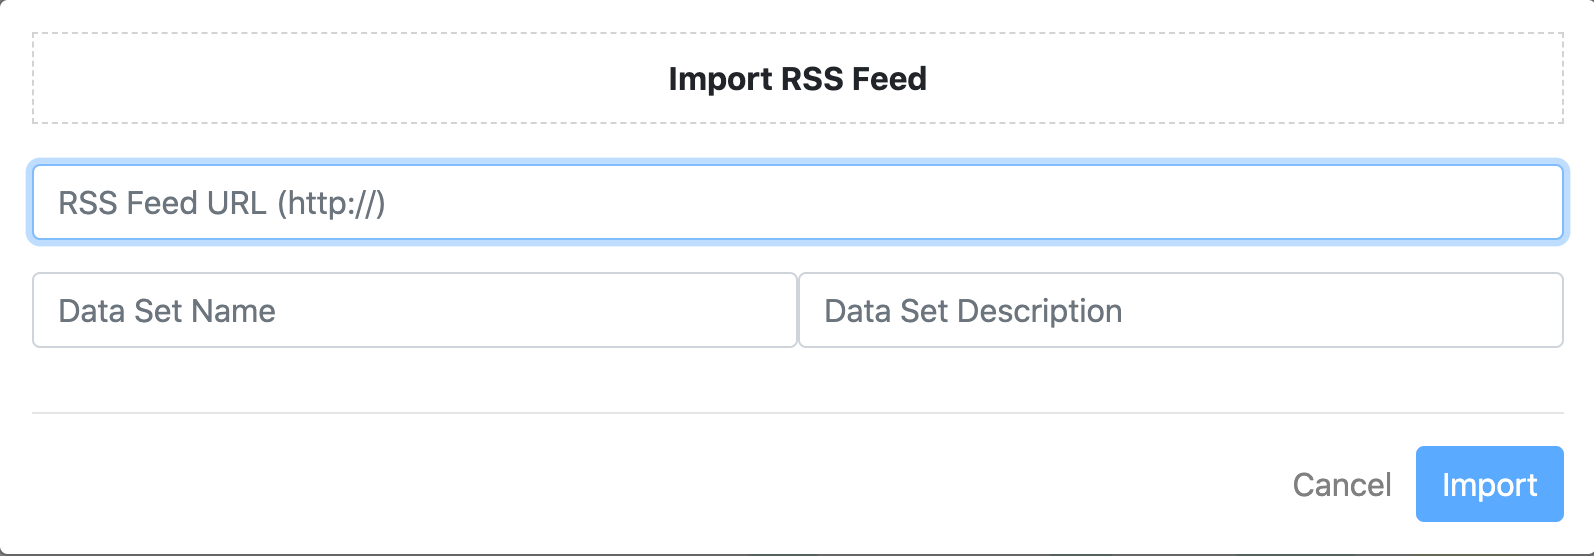
- Then, find the RSS Feed URL of the website and
copy and pasteit to the form. - Name the dataset and write a description by filling-in the form on the popup window.
- After filling-in the form, just hit the
importbutton. - It appears on the
Show Paneland is ready todrag and droponto the workspace.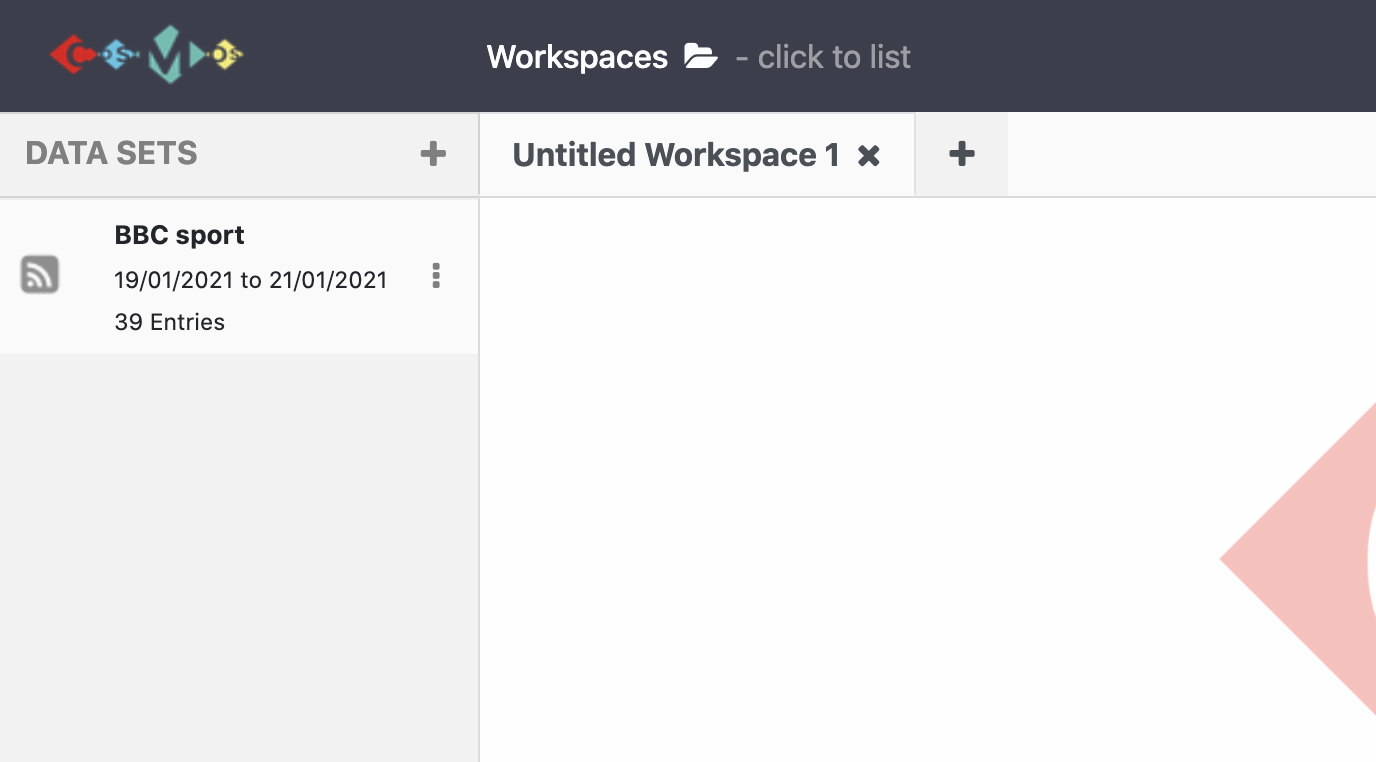
Tip: How to find the RSS Feed URL of a site?
There are several ways to find the RSS Feed URL of a website. You can find out the ways and instructions clicking this link.
You can also watch a YouTube video showing all COSMOS adding RSS feed processes by clicking the image below.
Challenge 1
Find the RSS Feed URLs for the following websites and start a collection using COSMOS:
- BBC Sport
- New York Times Home Page
Solution to challenge 1
- https://feeds.bbci.co.uk/sport/rss.xml
- https://rss.nytimes.com/services/xml/rss/nyt/HomePage.xml
Key Points
COSMOS allows us to collect data from a variety of websites using an RSS Feed.
COSMOS can collect RSS Feeds from multiple websites.